What Is On The Income Statement And Balance Sheet? These are key financial documents for understanding a company’s financial health. At income-partners.net, we help you interpret these statements, enabling strategic partnerships and increased revenue. By understanding key metrics, you can unlock profitable collaborations.
1. Understanding the Three Core Financial Statements
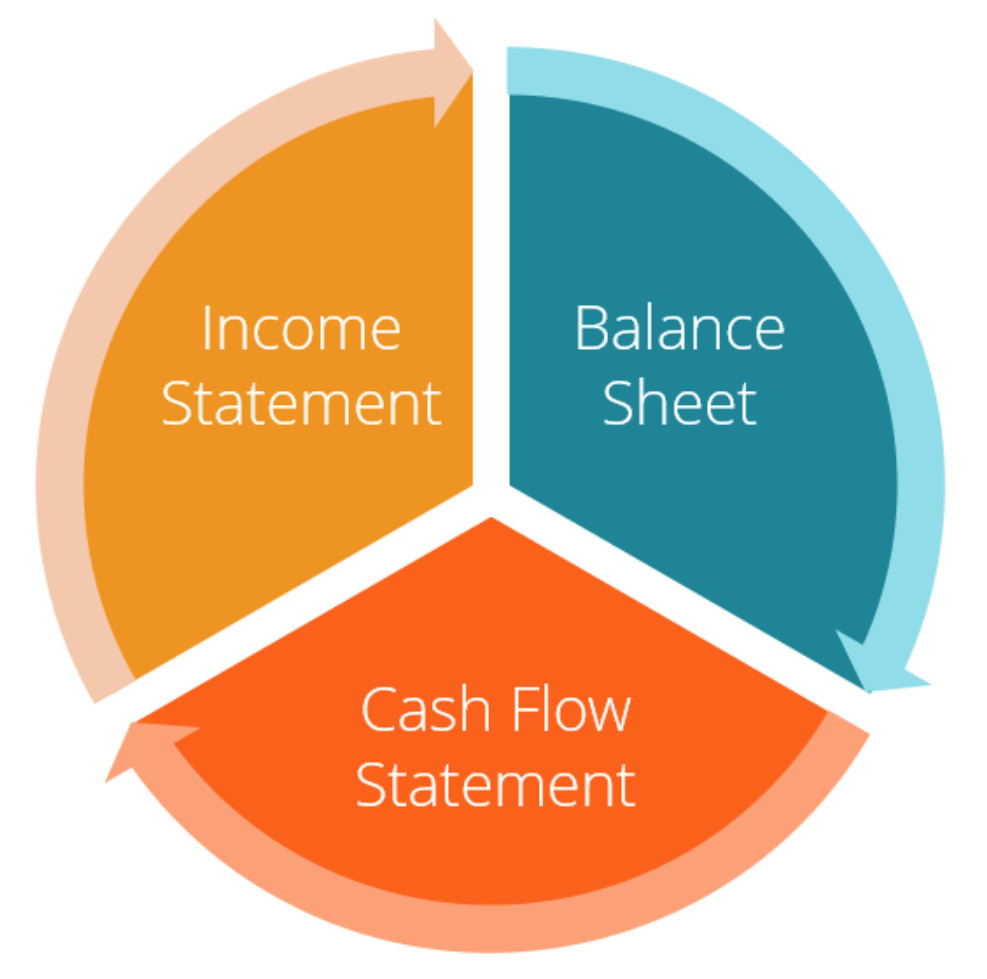
The three financial statements form the bedrock of financial reporting:
- The income statement,
- The balance sheet,
- The cash flow statement.
Each statement provides unique, crucial insights into a company’s financial performance and position. They are intricately connected, offering a comprehensive view when analyzed together.
2. The Income Statement: A Profitability Snapshot
2.1. What is the Income Statement?
The income statement, also known as the profit and loss (P&L) statement, summarizes a company’s financial performance over a specific period. It showcases revenues, expenses, and ultimately, the company’s net income or loss. It’s a vital tool for assessing profitability and operational efficiency.
2.2. Key Components of the Income Statement
 Income Statement – Reveals a company's financial performance over a reporting period
- Revenue: This represents the total income generated from the company’s primary business activities. This is often referred to as sales revenue.
- Cost of Goods Sold (COGS): This includes direct costs associated with producing goods or services.
- Gross Profit: Calculated as Revenue minus COGS, it indicates the profitability of a company’s core operations before considering operating expenses.
- Operating Expenses: These are costs incurred in running the business, such as salaries, rent, and marketing expenses.
- Operating Income: This is Gross Profit minus Operating Expenses, representing the profit earned from core business operations.
- Interest Expense: The cost of borrowing money.
- Income Tax Expense: The amount of taxes owed on the company’s taxable income.
- Net Income: Often called the “bottom line,” Net Income is the final profit after all expenses, interest, and taxes have been deducted from revenue.
2.3. Purpose of the Income Statement
The income statement serves several critical purposes:
- Profitability Assessment: It reveals whether a company is generating profits or incurring losses.
- Performance Trend Analysis: Analyzing income statements across multiple periods helps identify trends in revenue, expenses, and profitability.
- Operational Efficiency Evaluation: By examining cost of goods sold and operating expenses, stakeholders can assess how efficiently a company manages its resources.
2.4. Income Statement Example
Here’s a simplified example:
| Item | Amount |
|---|---|
| Revenue | $1,000,000 |
| Cost of Goods Sold | $600,000 |
| Gross Profit | $400,000 |
| Operating Expenses | $200,000 |
| Operating Income | $200,000 |
| Interest Expense | $20,000 |
| Income Tax Expense | $40,000 |
| Net Income | $140,000 |
2.5. Income Statement Insights for Partnerships
For potential partners, the income statement provides insights into a company’s ability to generate revenue and manage expenses. Consistent profitability and revenue growth are attractive indicators for collaboration.
3. The Balance Sheet: A Financial Position Overview
3.1. What is the Balance Sheet?
The balance sheet provides a snapshot of a company’s assets, liabilities, and equity at a specific point in time. It adheres to the fundamental accounting equation: Assets = Liabilities + Equity. This statement reveals what a company owns (assets), what it owes (liabilities), and the owners’ stake in the company (equity).
3.2. Key Components of the Balance Sheet
- Assets: These are resources owned by the company that have future economic value.
- Current Assets: Assets expected to be converted into cash or used up within one year (e.g., cash, accounts receivable, inventory).
- Non-Current Assets (Fixed Assets): Assets with a lifespan longer than one year (e.g., property, plant, and equipment (PP&E), intangible assets).
- Liabilities: These are obligations of the company to external parties.
- Current Liabilities: Obligations due within one year (e.g., accounts payable, short-term debt).
- Non-Current Liabilities (Long-Term Liabilities): Obligations due beyond one year (e.g., long-term debt, deferred tax liabilities).
- Equity: Represents the owners’ stake in the company.
- Common Stock: The value of shares issued to investors.
- Retained Earnings: Accumulated profits that have not been distributed as dividends.
3.3. Purpose of the Balance Sheet
The balance sheet offers insights into:
- Financial Structure: Showing the proportion of assets financed by debt (liabilities) and equity.
- Liquidity: Assessing the company’s ability to meet its short-term obligations.
- Solvency: Evaluating the company’s ability to meet its long-term obligations.
- Asset Management Efficiency: Understanding how effectively the company uses its assets to generate revenue.
3.4. Balance Sheet Example
| Item | Amount |
|---|---|
| Assets | |
| Current Assets | $500,000 |
| Non-Current Assets | $1,000,000 |
| Total Assets | $1,500,000 |
| Liabilities | |
| Current Liabilities | $300,000 |
| Non-Current Liabilities | $400,000 |
| Total Liabilities | $700,000 |
| Equity | |
| Common Stock | $500,000 |
| Retained Earnings | $300,000 |
| Total Equity | $800,000 |
| Total Liabilities & Equity | $1,500,000 |
3.5. Balance Sheet Insights for Partnerships
For potential partners, the balance sheet indicates financial stability and resource availability. A strong asset base and manageable liabilities suggest the company is well-positioned for growth and collaboration.
4. Key Differences Between the Income Statement and Balance Sheet
4.1. Time Frame
- Income Statement: Covers a period of time, such as a quarter or a year.
- Balance Sheet: Provides a snapshot at a specific point in time.
4.2. Focus
- Income Statement: Focuses on profitability.
- Balance Sheet: Focuses on financial position.
4.3. Accounts
- Income Statement: Reports revenues and expenses.
- Balance Sheet: Reports assets, liabilities, and equity.
4.4. Relationship
- Income Statement: Net income flows into the retained earnings section of the balance sheet.
- Balance Sheet: The ending cash balance is reconciled with the cash flow statement.
5. The Cash Flow Statement: Tracking Cash Movements
5.1. What is the Cash Flow Statement?
The cash flow statement (CFS) tracks the movement of cash both into and out of a company during a specified period. It supplements the income statement and balance sheet by providing a detailed look at how a company generates and uses cash.
5.2. Key Sections of the Cash Flow Statement
- Operating Activities: Cash flows resulting from the normal day-to-day business operations (e.g., cash received from customers, cash paid to suppliers).
- Investing Activities: Cash flows related to the purchase and sale of long-term assets (e.g., purchasing equipment, selling investments).
- Financing Activities: Cash flows related to how the company is financed (e.g., issuing debt, repaying loans, issuing stock, paying dividends).
5.3. Purpose of the Cash Flow Statement
The cash flow statement provides insights into:
- Liquidity: Demonstrating the company’s ability to generate sufficient cash to meet its obligations.
- Solvency: Showing how the company manages its long-term cash needs.
- Investment Capacity: Revealing the company’s ability to invest in future growth.
5.4. Cash Flow Statement Example
| Item | Amount |
|---|---|
| Cash Flow from Operations | $200,000 |
| Cash Flow from Investing | ($100,000) |
| Cash Flow from Financing | ($50,000) |
| Net Increase in Cash | $50,000 |
| Beginning Cash Balance | $100,000 |
| Ending Cash Balance | $150,000 |
5.5. Cash Flow Statement Insights for Partnerships
For potential partners, the cash flow statement indicates the company’s financial health and stability. Strong positive cash flow from operations suggests the company is sustainable and can meet its obligations.
6. How the Three Statements Interconnect
The three financial statements are interdependent and provide a holistic view of a company’s financial health.
- Net Income (Income Statement) → Retained Earnings (Balance Sheet): Net income from the income statement increases retained earnings on the balance sheet.
- Cash Balance (Cash Flow Statement) → Cash (Balance Sheet): The ending cash balance from the cash flow statement is reflected as cash on the balance sheet.
- Depreciation Expense (Income Statement) → Accumulated Depreciation (Balance Sheet): Depreciation expense reduces net income on the income statement and increases accumulated depreciation, a contra-asset account, on the balance sheet.
7. Financial Ratios: Interpreting the Numbers
Financial ratios use data from the financial statements to assess a company’s performance and financial health. Here are some common ratios:
7.1. Profitability Ratios
These ratios measure a company’s ability to generate profits.
- Gross Profit Margin: (Gross Profit / Revenue) – Measures the percentage of revenue remaining after deducting the cost of goods sold.
- Net Profit Margin: (Net Income / Revenue) – Measures the percentage of revenue remaining after deducting all expenses, including taxes and interest.
- Return on Equity (ROE): (Net Income / Shareholders’ Equity) – Measures how efficiently a company is using shareholders’ investments to generate profits.
7.2. Liquidity Ratios
These ratios measure a company’s ability to meet its short-term obligations.
- Current Ratio: (Current Assets / Current Liabilities) – Indicates whether a company has enough current assets to cover its current liabilities.
- Quick Ratio: ((Current Assets – Inventory) / Current Liabilities) – Similar to the current ratio but excludes inventory, which is less liquid.
7.3. Solvency Ratios
These ratios measure a company’s ability to meet its long-term obligations.
- Debt-to-Equity Ratio: (Total Debt / Shareholders’ Equity) – Indicates the proportion of debt and equity used to finance the company’s assets.
- Times Interest Earned Ratio: (EBIT / Interest Expense) – Measures a company’s ability to cover its interest payments with its earnings before interest and taxes (EBIT).
7.4. Efficiency Ratios
These ratios measure how efficiently a company uses its assets and liabilities.
- Inventory Turnover Ratio: (Cost of Goods Sold / Average Inventory) – Measures how many times a company has sold and replaced its inventory during a period.
- Accounts Receivable Turnover Ratio: (Net Credit Sales / Average Accounts Receivable) – Measures how efficiently a company collects its receivables.
8. Financial Statement Analysis: Best Practices
Analyzing financial statements requires a systematic approach:
- Understand the Business: Gain a thorough understanding of the company’s industry, business model, and competitive landscape.
- Review the Income Statement: Analyze revenue trends, cost of goods sold, operating expenses, and net income.
- Examine the Balance Sheet: Assess the company’s assets, liabilities, and equity.
- Study the Cash Flow Statement: Review cash flows from operating, investing, and financing activities.
- Calculate and Interpret Ratios: Use financial ratios to evaluate profitability, liquidity, solvency, and efficiency.
- Compare to Industry Benchmarks: Compare the company’s financial performance to industry averages and competitors.
- Identify Trends and Anomalies: Look for significant changes or unusual patterns in the financial data.
- Consider Qualitative Factors: Take into account non-financial factors, such as management quality, regulatory environment, and economic conditions.
9. Common Mistakes in Financial Statement Analysis
Avoid these common pitfalls when analyzing financial statements:
- Focusing Solely on Net Income: Net income can be manipulated through accounting practices. Consider other metrics, like cash flow from operations.
- Ignoring Industry Context: Financial ratios and performance metrics should be evaluated within the context of the company’s industry.
- Relying on a Single Year’s Data: Analyzing financial statements over multiple periods provides a more accurate picture of a company’s performance.
- Neglecting the Notes to the Financial Statements: These notes provide additional details and explanations about the financial data.
10. The Role of Financial Statements in Partnership Decisions
Financial statements are crucial in evaluating potential business partners:
- Assessing Financial Stability: Determine whether the partner is financially sound and capable of meeting its obligations.
- Evaluating Profitability: Understand the partner’s ability to generate profits and returns.
- Identifying Potential Risks: Look for red flags, such as high debt levels or declining revenues.
- Negotiating Terms: Use financial data to negotiate favorable terms for the partnership.
- Monitoring Performance: Track the partner’s financial performance to ensure the partnership is mutually beneficial.
11. Financial Statements and Strategic Partnerships at income-partners.net
At income-partners.net, we understand the importance of financial statement analysis in forming successful strategic partnerships. Our platform offers tools and resources to help you:
- Identify Potential Partners: Find companies with strong financial performance and compatible business models.
- Evaluate Financial Health: Access detailed financial information and analysis.
- Connect with Experts: Consult with financial professionals for expert advice.
By leveraging our resources, you can make informed decisions and build partnerships that drive revenue growth and long-term success.
12. Understanding Financial Statements for Investors
For investors, financial statements provide a critical tool for evaluating investment opportunities. Here’s how:
12.1. Assessing Company Valuation
Financial statements are fundamental in determining a company’s valuation. Techniques such as discounted cash flow (DCF) analysis, which relies on future cash flow projections derived from financial statements, help investors estimate the intrinsic value of a company.
12.2. Identifying Growth Opportunities
By analyzing trends in revenue, earnings, and cash flow, investors can identify companies with strong growth potential. Consistent growth and healthy financials indicate that the company is well-positioned to capitalize on market opportunities.
12.3. Gauging Financial Health
Financial statements provide insights into a company’s financial stability and sustainability. Investors can assess whether the company has sufficient assets to cover its liabilities and whether it can generate enough cash to meet its obligations.
12.4. Comparing Companies
Financial statements enable investors to compare the performance of different companies within the same industry. By analyzing key ratios and metrics, investors can identify which companies are outperforming their peers.
13. How Financial Statements Inform Business Strategy
13.1. Resource Allocation
Financial statements help businesses make informed decisions about resource allocation. By analyzing which areas of the business are generating the most revenue and profit, companies can allocate resources more effectively.
13.2. Performance Measurement
Financial statements provide a benchmark for measuring performance. Companies can track their progress over time and identify areas where they need to improve.
13.3. Strategic Planning
Financial statements inform strategic planning by providing insights into the company’s strengths, weaknesses, opportunities, and threats (SWOT analysis). This helps companies develop strategies that align with their financial goals.
14. Regulatory Requirements for Financial Statements
14.1. GAAP (Generally Accepted Accounting Principles)
In the United States, financial statements must be prepared in accordance with Generally Accepted Accounting Principles (GAAP). GAAP provides a common set of accounting standards and procedures that ensure financial statements are consistent, transparent, and comparable.
14.2. SEC (Securities and Exchange Commission)
Public companies in the United States are required to file financial statements with the Securities and Exchange Commission (SEC). These filings, which include annual reports (10-K) and quarterly reports (10-Q), provide detailed information about the company’s financial performance and position.
14.3. International Financial Reporting Standards (IFRS)
Many countries outside the United States use International Financial Reporting Standards (IFRS). IFRS is a set of accounting standards developed by the International Accounting Standards Board (IASB). While there are some differences between GAAP and IFRS, the two sets of standards are becoming increasingly aligned.
15. Real-World Examples of Financial Statement Analysis
15.1. Case Study: Apple Inc.
Analyzing Apple’s financial statements reveals a company with strong revenue growth, high profitability, and a solid balance sheet. Apple’s consistent innovation and brand loyalty have translated into impressive financial performance.
15.2. Case Study: General Electric (GE)
In contrast, General Electric’s financial statements in recent years have revealed challenges, including declining revenues, high debt levels, and restructuring efforts. This demonstrates the importance of monitoring financial statements to identify potential risks.
16. Emerging Trends in Financial Reporting
16.1. Sustainability Reporting
There is a growing trend toward sustainability reporting, which involves disclosing information about a company’s environmental, social, and governance (ESG) performance. Sustainability reporting can help companies attract investors and customers who are concerned about these issues.
16.2. Integrated Reporting
Integrated reporting combines financial and non-financial information to provide a more holistic view of a company’s performance. This approach recognizes that financial performance is closely linked to other factors, such as human capital, innovation, and relationships.
17. Tools and Technologies for Financial Statement Analysis
17.1. Accounting Software
Accounting software, such as QuickBooks and Xero, can help businesses prepare financial statements more efficiently. These tools automate many of the manual tasks involved in financial reporting.
17.2. Financial Analysis Software
Financial analysis software, such as Bloomberg Terminal and FactSet, provides access to detailed financial data and analytical tools. These tools can help investors and analysts perform in-depth financial statement analysis.
17.3. Spreadsheet Software
Spreadsheet software, such as Microsoft Excel and Google Sheets, remains a popular tool for financial statement analysis. These programs allow users to perform calculations, create charts, and analyze data in a flexible and customizable way.
18. Tips for Improving Your Financial Literacy
18.1. Take a Course
Consider taking a course in accounting or finance to improve your understanding of financial statements. Many online and offline courses are available to suit different levels of experience.
18.2. Read Books and Articles
Read books and articles about financial statement analysis to learn from experts in the field. Numerous resources are available to help you deepen your knowledge.
18.3. Follow Industry News
Stay up-to-date on industry news and trends to understand how financial statements are used in practice. Follow reputable news sources and financial publications.
18.4. Practice Analyzing Financial Statements
The best way to improve your financial literacy is to practice analyzing financial statements. Start by reviewing the financial statements of companies you are familiar with and gradually move on to more complex cases.
19. Actionable Strategies for Leveraging Financial Statements
19.1. For Business Owners
Use financial statements to monitor your company’s performance, make informed decisions, and attract investors and partners. Regularly review your financial statements with your management team and advisors.
19.2. For Investors
Use financial statements to evaluate investment opportunities, assess company valuation, and identify potential risks. Diversify your portfolio and seek advice from financial professionals.
19.3. For Partners
Use financial statements to evaluate potential business partners, negotiate terms, and monitor performance. Ensure that you have access to reliable and up-to-date financial information.
20. How income-partners.net Can Help You Succeed
At income-partners.net, we are committed to helping you achieve your business goals through strategic partnerships. Our platform provides a comprehensive suite of tools and resources, including:
- Partner Matching: Find partners that align with your business objectives and values.
- Financial Analysis Tools: Access detailed financial information and analysis to evaluate potential partners.
- Expert Advice: Consult with financial professionals for expert guidance.
- Networking Opportunities: Connect with other business leaders and potential partners.
By joining income-partners.net, you can unlock a world of opportunities and build partnerships that drive revenue growth and long-term success.
21. Case Studies: Successful Partnerships Driven by Financial Statement Insights
21.1. Strategic Alliance Example
Consider a scenario where Company A, a tech startup, seeks a partnership with Company B, a well-established manufacturing firm. By examining Company B’s balance sheet, Company A identifies a robust asset base and manageable debt, indicating financial stability. Simultaneously, reviewing Company B’s income statement reveals consistent revenue, although profit margins are thin.
Based on these insights, Company A proposes a partnership aimed at improving Company B’s operational efficiency and profitability. Together, they integrate Company A’s cutting-edge technology into Company B’s manufacturing processes, streamlining operations and significantly boosting profit margins. This alliance, rooted in thorough financial statement analysis, results in mutual success.
21.2. Joint Venture Success
Two companies, Company X, a retail giant, and Company Y, a logistics expert, decide to form a joint venture. By analyzing Company Y’s cash flow statement, Company X confirms strong positive cash flow from operations, signaling financial sustainability.
Moreover, Company X’s review of Company Y’s balance sheet reveals healthy liquidity. These insights assure Company X of Company Y’s capability to meet short-term obligations. Subsequently, they collaborate on optimizing supply chain management, reducing costs, and enhancing service quality. The joint venture, underpinned by comprehensive financial analysis, achieves remarkable outcomes for both entities.
21.3. Investment Partnership Example
An investment firm, Firm Z, considers investing in Company Q, an innovative green energy business. Firm Z assesses Company Q’s income statement, noting consistent revenue growth and increasing net profits, signaling revenue-generation capabilities.
Firm Z also analyzes Company Q’s balance sheet and observes a sustainable debt-to-equity ratio, confirming financial stability. Based on these assessments, Firm Z decides to invest in Company Q, supporting its growth aspirations and contributing to a sustainable future. This strategic investment, informed by meticulous financial statement review, yields substantial returns.
22. Navigating Financial Jargon: A Glossary of Essential Terms
To facilitate your understanding of financial statements, here’s a glossary of essential terms:
22.1. Assets
Resources owned by a company that have future economic value (e.g., cash, accounts receivable, inventory, property, plant, and equipment).
22.2. Liabilities
Obligations of a company to external parties (e.g., accounts payable, short-term debt, long-term debt).
22.3. Equity
The owners’ stake in the company, representing the residual interest in the assets after deducting liabilities (e.g., common stock, retained earnings).
22.4. Revenue
Income generated from a company’s primary business activities (also known as sales).
22.5. Cost of Goods Sold (COGS)
Direct costs associated with producing goods or services (e.g., raw materials, labor).
22.6. Gross Profit
Revenue minus the cost of goods sold, indicating the profitability of a company’s core operations.
22.7. Operating Expenses
Costs incurred in running the business (e.g., salaries, rent, marketing expenses).
22.8. Net Income
The final profit after deducting all expenses, interest, and taxes from revenue (also known as the “bottom line”).
22.9. Cash Flow from Operations
Cash flows resulting from normal day-to-day business operations.
22.10. Cash Flow from Investing
Cash flows related to the purchase and sale of long-term assets.
22.11. Cash Flow from Financing
Cash flows related to how the company is financed (e.g., issuing debt, repaying loans, issuing stock, paying dividends).
23. Overcoming Challenges in Financial Statement Interpretation
23.1. Complex Accounting Standards
Financial statements can be complex, and understanding accounting standards can be challenging.
To overcome this, consider consulting with a financial professional or taking a course in accounting. Additionally, familiarize yourself with GAAP or IFRS, depending on the context.
23.2. Data Overload
Financial statements contain a large amount of data, which can be overwhelming.
Focus on key metrics and ratios that are relevant to your goals. Start by reviewing the income statement, balance sheet, and cash flow statement, then delve deeper into specific areas of interest.
23.3. Potential for Manipulation
Financial statements can be manipulated through accounting practices.
Be aware of this possibility and look for red flags. Cross-reference information with other sources and consider consulting with a financial professional if you have concerns.
24. Resources for Continuous Learning in Financial Analysis
24.1. Online Courses
Platforms like Coursera, edX, and Udemy offer courses on financial statement analysis and accounting. These courses can provide structured learning and help you develop your skills.
24.2. Professional Certifications
Consider pursuing professional certifications, such as the Chartered Financial Analyst (CFA) or Certified Public Accountant (CPA) designations. These certifications demonstrate your expertise in financial analysis and accounting.
24.3. Industry Publications
Stay informed by reading industry publications such as The Wall Street Journal, Bloomberg, and Forbes. These publications provide news, analysis, and insights on financial markets and companies.
24.4. Networking Events
Attend networking events and conferences to connect with other professionals in finance and accounting. These events can provide opportunities to learn from experts and share your knowledge.
25. Future-Proofing Your Financial Partnership Strategy
25.1. Embrace Digital Transformation
Leverage technology and digital tools to streamline your financial statement analysis processes. Embrace automation, artificial intelligence, and cloud computing to improve efficiency and accuracy.
25.2. Prioritize Data Security
Protect your financial data by implementing robust security measures. Use encryption, access controls, and data loss prevention tools to safeguard your sensitive information.
25.3. Foster a Culture of Transparency
Promote transparency in your financial partnerships by sharing relevant information and communicating openly. This will help build trust and strengthen your relationships.
25.4. Stay Agile
Be prepared to adapt your financial partnership strategy to changing market conditions. Monitor key trends and developments and adjust your approach as needed.
Understanding what is on the income statement and balance sheet is crucial for making informed business decisions and forming successful partnerships. At income-partners.net, we provide the resources and support you need to navigate the complexities of financial analysis and achieve your business goals.
FAQ: Understanding the Income Statement and Balance Sheet
1. What is the primary difference between the income statement and balance sheet?
The income statement shows a company’s financial performance over a period, while the balance sheet shows a company’s financial position at a specific point in time.
2. How does net income from the income statement relate to the balance sheet?
Net income from the income statement increases retained earnings on the balance sheet.
3. What are the key components of the balance sheet?
The key components are assets, liabilities, and equity.
4. What does the income statement tell me about a company?
It tells you about a company’s revenues, expenses, and profitability over a specific period.
5. How can I use the balance sheet to assess a company’s financial health?
You can assess liquidity, solvency, and financial structure.
6. What is the role of the cash flow statement in conjunction with the income statement and balance sheet?
It reconciles net income with cash flow and shows how cash moves through a company.
7. What financial ratios can I use to analyze a company’s performance?
Profitability, liquidity, solvency, and efficiency ratios.
8. How often should companies prepare financial statements?
Public companies typically prepare quarterly and annual financial statements.
9. What are some common mistakes to avoid when analyzing financial statements?
Focusing solely on net income, ignoring industry context, and relying on a single year’s data.
10. Where can I find reliable financial information about public companies?
The SEC’s EDGAR database, company websites, and financial news outlets.
Ready to discover profitable partnerships and boost your income? Visit income-partners.net today to explore our resources and connect with potential partners. Address: 1 University Station, Austin, TX 78712, United States. Phone: +1 (512) 471-3434. Let’s build success together!