Making an income statement in Excel is crucial for anyone aiming to understand a company’s financial performance and profitability. Income-partners.net offers expert insights and resources to help you master this essential skill, enabling you to effectively track revenue, expenses, and ultimately, your net income. Let’s dive into how you can create an income statement using Excel, focusing on key aspects such as single-step vs. multi-step approaches, and understanding vital financial metrics. We’ll explore how to enhance your financial analysis using these tools.
1. What Is An Income Statement And Why Use Excel?
An income statement, also known as a profit and loss (P&L) statement, showcases a company’s financial performance over a specific period by summarizing revenues, costs, and expenses. Creating an income statement in Excel offers flexibility and customization, making it an ideal tool for businesses of all sizes.
Here’s why using Excel for your income statement is beneficial:
- Customization: Tailor the template to fit your specific business needs.
- Flexibility: Easily adjust calculations and categories as your business evolves.
- Accessibility: Excel is widely available and user-friendly.
- Automation: Set up formulas to automate calculations and reduce errors.
The income statement complements other financial statements like the balance sheet and cash flow statement, providing a complete picture of a company’s financial health. Excel enables you to link these statements for a more integrated financial analysis.
2. Understanding The Key Components Of An Income Statement
To effectively create an income statement in Excel, you need to understand its core components. These elements provide insights into your company’s profitability and operational efficiency.
Key Components of an Income Statement:
- Revenue: Total income generated from primary business activities.
- Cost of Goods Sold (COGS): Direct costs associated with producing goods or services.
- Gross Profit: Revenue minus COGS, indicating profitability before operating expenses.
- Operating Expenses: Costs incurred in the normal course of business, such as salaries, rent, and marketing.
- Operating Income (EBIT): Earnings Before Interest and Taxes, reflecting profitability from core operations.
- Non-Operating Revenues and Expenses: Income and expenses from activities outside the primary business, such as interest income or expenses.
- Earnings Before Tax (EBT): Income before deducting income taxes.
- Income Tax Expense: The amount of income taxes owed.
- Net Income: The final profit or loss after all revenues and expenses are accounted for.
Understanding these components will help you structure your income statement in Excel effectively and accurately.
3. Single-Step Vs. Multi-Step Income Statement: Which Is Right For You?
Choosing between a single-step and multi-step income statement format depends on the level of detail and analysis you need. Each format offers a different perspective on your company’s financial performance.
Single-Step Income Statement:
- Simplicity: Calculates net income with a single subtraction of total expenses from total revenues.
- Use Case: Suitable for small businesses with straightforward operations.
- Pros: Easy to prepare and understand.
- Cons: Lacks detailed insights into different areas of profitability.
Multi-Step Income Statement:
- Detail: Separates operating revenues and expenses from non-operating ones.
- Use Case: Preferred by larger companies for a more comprehensive analysis.
- Pros: Provides insights into gross profit, operating income, and net income.
- Cons: More complex to prepare.
According to research from the University of Texas at Austin’s McCombs School of Business, in July 2025, multi-step income statements provide a clearer view of a company’s financial health by highlighting key profitability metrics. The choice depends on the complexity of your business and the depth of analysis required.
4. Setting Up Your Excel Template: A Step-By-Step Guide
Creating an income statement in Excel involves setting up an organized and functional template. Follow these steps to build an effective income statement.
Step-by-Step Guide:
- Open Excel: Start a new spreadsheet.
- Headers: Enter the company name and the period covered by the statement.
- Revenue Section:
- Label rows for different revenue streams (e.g., Sales Revenue, Service Revenue).
- Enter the corresponding amounts in the appropriate columns.
- Cost of Goods Sold (COGS) Section:
- List direct costs related to producing goods or services (only for the multi-step format).
- Calculate and enter the total COGS.
- Gross Profit Calculation:
- Use the formula
=Total Revenue - Total COGSto calculate gross profit (multi-step only).
- Use the formula
- Operating Expenses Section:
- List all operating expenses (e.g., Salaries, Rent, Utilities, Marketing).
- Enter the amounts for each expense.
- Operating Income (EBIT) Calculation:
- Use the formula
=Gross Profit - Total Operating Expensesto calculate operating income (multi-step only).
- Use the formula
- Non-Operating Items Section:
- List non-operating revenues and expenses (e.g., Interest Income, Interest Expense).
- Calculate the net amount.
- Earnings Before Tax (EBT) Calculation:
- Use the formula
=Operating Income + Net Non-Operating Itemsto calculate EBT (multi-step only).
- Use the formula
- Income Tax Expense Section:
- Enter the amount of income tax expense.
- Net Income Calculation:
- Use the formula
=EBT - Income Tax Expenseto calculate net income (multi-step only). - For a single-step, use
=Total Revenue - Total Expenses.
- Use the formula
- Format and Review:
- Format the spreadsheet for readability.
- Double-check all formulas and data entries for accuracy.
By following these steps, you can create a customized income statement in Excel that meets your specific needs.
5. Formulas And Functions To Automate Your Income Statement
Excel’s formulas and functions are essential for automating calculations and ensuring accuracy in your income statement. Here are some key formulas to use:
Essential Excel Formulas:
- SUM: Adds values in a range of cells.
=SUM(A1:A10) - SUBTRACT: Subtracts one value from another.
=A1-B1 - IF: Performs a logical test and returns one value if true and another if false.
=IF(A1>0,"Profit","Loss") - AVERAGE: Calculates the average of a range of cells.
=AVERAGE(A1:A10) - MAX/MIN: Finds the highest or lowest value in a range.
=MAX(A1:A10),=MIN(A1:A10)
Advanced Tips:
- Named Ranges: Define names for specific cells or ranges to make formulas easier to read.
- Error Checking: Use Excel’s error-checking tools to identify and correct mistakes.
- Conditional Formatting: Highlight important values or trends automatically.
By using these formulas, you can automate your income statement, saving time and reducing the risk of errors.
6. Analyzing Revenue: Strategies For Growth
Revenue is the lifeblood of any business. Analyzing your revenue streams in Excel can reveal valuable insights for growth and strategic decision-making.
Strategies for Revenue Analysis:
- Trend Analysis: Compare revenue over different periods to identify trends.
- Example: Use a line chart to visualize monthly revenue growth.
- Segmentation: Break down revenue by product, service, or customer segment.
- Example: Create a pie chart to show the percentage of revenue from each product line.
- Variance Analysis: Compare actual revenue to budgeted or forecasted revenue.
- Example: Use conditional formatting to highlight significant variances.
- Sales Metrics: Track key sales metrics such as average deal size, conversion rates, and customer lifetime value.
- Example: Calculate customer lifetime value using historical sales data.
According to a Harvard Business Review study, companies that effectively analyze their revenue streams are more likely to identify growth opportunities and improve profitability.
7. Managing Expenses: Cutting Costs Effectively
Effective expense management is crucial for improving profitability. Using Excel to track and analyze expenses can help you identify areas where you can cut costs without sacrificing quality.
Strategies for Expense Management:
- Categorization: Categorize expenses into fixed, variable, and discretionary.
- Example: Use different rows to list each type of expense.
- Budgeting: Create a budget and compare actual expenses to budgeted amounts.
- Example: Use the
IFfunction to highlight expenses that exceed the budget.
- Example: Use the
- Variance Analysis: Analyze variances between actual and budgeted expenses.
- Example: Calculate the percentage variance for each expense category.
- Cost-Cutting Measures: Identify and implement cost-cutting measures based on your analysis.
- Example: Negotiate better rates with suppliers or reduce discretionary spending.
By diligently managing expenses in Excel, you can improve your bottom line and increase profitability.
8. Depreciation And Amortization: Accounting For Long-Term Assets
Depreciation and amortization are essential for accurately accounting for the decline in value of long-term assets. Excel can help you calculate and track these expenses.
Key Concepts:
- Depreciation: The decrease in value of tangible assets over time (e.g., buildings, equipment).
- Amortization: The spreading of the cost of intangible assets over their useful life (e.g., patents, copyrights).
Calculation Methods:
- Straight-Line Depreciation: (Cost – Salvage Value) / Useful Life
- Excel Formula:
=(A1-B1)/C1
- Excel Formula:
- Declining Balance Depreciation: Book Value * Depreciation Rate
- Excel Formula:
=B1*A1
- Excel Formula:
- Units of Production Depreciation: ((Cost – Salvage Value) / Total Units) * Units Produced
- Excel Formula:
=((A1-B1)/C1)*D1
- Excel Formula:
Tracking depreciation and amortization in Excel ensures that your financial statements accurately reflect the value of your assets and expenses.
9. Operating Income (EBIT): Measuring Core Business Performance
Operating Income, or Earnings Before Interest and Taxes (EBIT), is a key metric for evaluating the performance of your core business operations. Excel can help you calculate and analyze EBIT to gain insights into your company’s profitability.
Calculating EBIT:
- Multi-Step Income Statement: EBIT = Gross Profit – Operating Expenses
Analyzing EBIT:
- Trend Analysis: Track EBIT over time to identify trends and patterns.
- Benchmarking: Compare your EBIT to industry averages to assess your company’s performance.
- Ratio Analysis: Calculate EBIT margins to measure profitability.
Benefits of Analyzing EBIT:
- Provides a clear view of core business profitability.
- Helps identify areas for improvement in operations.
- Facilitates comparisons with competitors.
By focusing on EBIT, you can gain a deeper understanding of your company’s core business performance and make informed decisions to improve profitability.
10. Non-Operating Revenues And Expenses: Understanding The Complete Picture
Non-operating revenues and expenses are items that are not directly related to your company’s core business operations. Including these items in your income statement provides a complete picture of your financial performance.
Examples of Non-Operating Items:
- Interest Income
- Interest Expense
- Gains or Losses from the Sale of Assets
- Rental Income
- Lawsuit Settlements
Importance of Tracking Non-Operating Items:
- Provides a comprehensive view of all income and expenses.
- Helps identify potential sources of additional income.
- Ensures accurate calculation of net income.
By carefully tracking non-operating items in Excel, you can gain a more complete understanding of your company’s financial health.
11. Earnings Before Tax (EBT): Planning For Taxes
Earnings Before Tax (EBT) is the income your company has earned before deducting income taxes. Understanding EBT is crucial for tax planning and financial forecasting.
Calculating EBT:
- EBT = Operating Income + Non-Operating Revenues – Non-Operating Expenses
Using EBT for Tax Planning:
- Estimate your company’s tax liability.
- Identify opportunities to reduce your tax burden.
- Plan for future tax payments.
Benefits of Tracking EBT:
- Facilitates accurate tax planning.
- Helps in forecasting future financial performance.
- Provides insights into the overall profitability of your company.
By effectively tracking EBT in Excel, you can make informed decisions about tax planning and financial management.
12. Net Income: The Bottom Line And What It Means
Net Income is the final profit or loss your company has earned after all revenues and expenses have been accounted for, including taxes. It is the bottom line and a critical indicator of your company’s financial success.
Calculating Net Income:
- Net Income = EBT – Income Tax Expense
Interpreting Net Income:
- A positive net income indicates profitability.
- A negative net income indicates a loss.
Using Net Income for Decision-Making:
- Assess the overall financial health of your company.
- Make decisions about investments, expansion, and dividends.
- Attract investors and lenders.
Tracking net income in Excel provides valuable insights into your company’s financial performance and helps you make informed decisions.
13. Customizing Your Excel Template: Tips And Tricks
Customizing your Excel template can make it more user-friendly and tailored to your specific business needs. Here are some tips and tricks:
Tips for Customization:
- Use Named Ranges: Assign names to cells or ranges to make formulas easier to read.
- Create Drop-Down Lists: Use data validation to create drop-down lists for categories and options.
- Add Comments: Insert comments to explain formulas or provide instructions.
- Use Conditional Formatting: Highlight important values or trends automatically.
- Create Charts and Graphs: Visualize your data with charts and graphs for easy interpretation.
By customizing your Excel template, you can create a powerful tool for financial analysis and decision-making.
14. Common Mistakes To Avoid When Creating An Income Statement In Excel
Creating an income statement in Excel requires attention to detail. Here are some common mistakes to avoid:
Common Mistakes:
- Incorrect Formulas: Double-check all formulas for accuracy.
- Data Entry Errors: Ensure that all data is entered correctly.
- Omission of Expenses: Include all relevant expenses to avoid understating costs.
- Misclassification of Items: Classify revenues and expenses correctly.
- Ignoring Depreciation and Amortization: Account for the decline in value of long-term assets.
By avoiding these common mistakes, you can ensure the accuracy and reliability of your income statement.
15. Advanced Techniques: Ratio Analysis And Trend Analysis
Ratio analysis and trend analysis are advanced techniques that can provide deeper insights into your company’s financial performance. Excel can help you perform these analyses efficiently.
Ratio Analysis:
- Gross Profit Margin: (Gross Profit / Revenue) * 100
- Operating Profit Margin: (Operating Income / Revenue) * 100
- Net Profit Margin: (Net Income / Revenue) * 100
Trend Analysis:
- Track key metrics over time to identify trends and patterns.
- Use charts and graphs to visualize your data.
By using ratio analysis and trend analysis, you can gain a more comprehensive understanding of your company’s financial performance and make informed decisions.
16. Integrating With Other Financial Statements: A Holistic View
The income statement is just one piece of the puzzle. Integrating it with other financial statements, such as the balance sheet and cash flow statement, provides a holistic view of your company’s financial health.
Integration Strategies:
- Link Excel Worksheets: Create links between different worksheets to pull data from one statement to another.
- Use Consistent Categories: Use the same categories and classifications across all financial statements.
- Reconcile Data: Reconcile data between statements to ensure accuracy and consistency.
By integrating your financial statements, you can gain a more complete and accurate understanding of your company’s financial performance.
17. Examples Of Income Statements In Different Industries
Different industries have different revenue and expense structures. Here are examples of income statements in various industries:
Service Industry:
- Revenue: Service Fees
- Expenses: Salaries, Rent, Marketing
Retail Industry:
- Revenue: Sales Revenue
- Expenses: Cost of Goods Sold, Salaries, Rent
Manufacturing Industry:
- Revenue: Sales Revenue
- Expenses: Cost of Goods Sold, Manufacturing Overhead, Salaries
By understanding the specific characteristics of your industry, you can create an income statement that accurately reflects your company’s financial performance.
18. How To Present Your Income Statement To Stakeholders
Presenting your income statement effectively is crucial for communicating your company’s financial performance to stakeholders. Here are some tips:
Presentation Tips:
- Use Clear and Concise Language: Avoid jargon and technical terms.
- Highlight Key Metrics: Focus on the most important numbers, such as net income and profit margins.
- Use Visual Aids: Charts and graphs can help illustrate trends and patterns.
- Provide Context: Explain the factors that have influenced your company’s financial performance.
By presenting your income statement effectively, you can build trust and confidence with stakeholders.
19. Staying Compliant: GAAP And IFRS Considerations
When creating an income statement, it’s important to comply with accounting standards, such as Generally Accepted Accounting Principles (GAAP) and International Financial Reporting Standards (IFRS).
Key Differences Between GAAP and IFRS:
- Expense Classification: IFRS allows companies to classify expenses by function or nature, while GAAP does not have specific requirements.
- Unusual Items: GAAP defines unusual transactions as those that are highly abnormal, while IFRS does not have a definition for unusual items.
- Discontinued Operations: IFRS has specific criteria for classifying discontinued operations.
By understanding and complying with GAAP and IFRS, you can ensure that your income statement is accurate and reliable.
20. Leveraging Income-Partners.Net For Financial Insights And Partnerships
To further enhance your financial analysis and business growth, leverage the resources available at income-partners.net.
How Income-Partners.Net Can Help:
- Expert Advice: Access expert insights and advice on financial management and business strategy.
- Partnership Opportunities: Connect with potential partners to expand your business and increase revenue.
- Tools and Resources: Utilize a variety of tools and resources to improve your financial analysis.
- Community Support: Join a community of like-minded professionals to share ideas and best practices.
By leveraging income-partners.net, you can gain a competitive edge and achieve your business goals.
21. Income Statement Or Statement Of Comprehensive Income?
A statement of comprehensive income provides a broader view of a company’s financial performance by including items not recognized in the income statement, such as unrealized gains and losses on investments. It can be presented as a single document or as two separate statements. This provides a more in-depth analysis of financial performance, as recommended by the University of Texas at Austin’s McCombs School of Business, enhancing strategic decision-making.
22. Nature Or Function?
Operating expenses can be categorized by ‘nature’ (raw materials, wages, depreciation) or ‘function’ (cost of sales, distribution costs, admin expenses). The choice depends on the company’s reporting goals and the type of financial analysis required. IFRS IAS 1 requires entities to disclose the nature of expenses when using the function classification.
23. Do All Businesses Have To Produce An Income Statement?
Most businesses are expected to produce an income statement regularly for financial management, tax planning, and compliance. Public companies are legally required to report quarterly and annually, regulated by bodies like the SEC in the United States, following US GAAP. Private companies also need income statements for managing finances and obtaining financing. Small businesses and non-profits use them to understand their financial performance and ensure accountability.
Even if not legally required, maintaining an income statement is a best practice for effective business management.
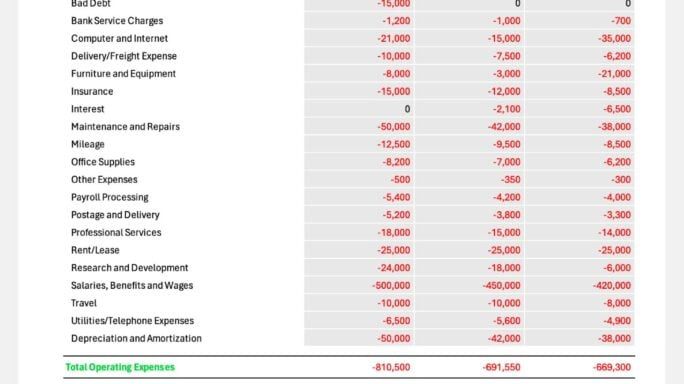 Example of an income statement template, showcasing single-step format for simplicity
FAQ: Mastering Income Statements In Excel
1. What Is The Primary Purpose Of An Income Statement?
The primary purpose of an income statement is to showcase how revenues are transformed into net income (or net loss) by deducting all expenses from the total revenue.
2. What Are The Key Components Of An Income Statement?
The key components include revenue, cost of goods sold (COGS), gross profit, operating expenses, operating income (EBIT), non-operating revenues and expenses, earnings before tax (EBT), income tax expense, and net income.
3. What Is The Difference Between A Single-Step And Multi-Step Income Statement?
A single-step income statement calculates net income with one subtraction: total expenses from total revenues. A multi-step income statement breaks down operating and non-operating items for a detailed view.
4. How Can Excel Formulas Automate Income Statement Calculations?
Excel formulas like SUM, SUBTRACT, IF, AVERAGE, MAX, and MIN automate calculations, reducing errors and saving time.
5. How Can Revenue Analysis In Excel Drive Business Growth?
By tracking trends, segmenting revenue by product or customer, performing variance analysis, and monitoring sales metrics.
6. What Strategies Can Be Used In Excel For Effective Expense Management?
Categorizing expenses, budgeting, variance analysis, and implementing cost-cutting measures.
7. What Is The Importance Of Calculating Depreciation And Amortization In Excel?
It ensures that financial statements accurately reflect the value of assets by accounting for their decline over time.
8. How Does Analyzing Operating Income (EBIT) Benefit A Company?
Provides a clear view of core business profitability, identifies areas for improvement, and facilitates comparisons with competitors.
9. Why Is It Important To Track Non-Operating Revenues And Expenses?
It provides a comprehensive view of all income and expenses, identifying potential sources of additional income and ensuring accurate net income calculation.
10. How Can Integrating The Income Statement With Other Financial Statements Provide A Holistic View?
By creating links between worksheets, using consistent categories, and reconciling data to ensure accuracy and consistency.
Crafting an income statement in Excel allows for detailed financial insight, which can be further enhanced by exploring partnership opportunities. Visit income-partners.net to discover how strategic alliances can amplify your revenue streams and optimize your financial strategies in the USA, especially in thriving hubs like Austin.
Address: 1 University Station, Austin, TX 78712, United States.
Phone: +1 (512) 471-3434.
Website: income-partners.net.