Finding the gross profit on an income statement is a crucial step for business owners and investors alike, and income-partners.net can guide you through the process. Gross profit, which is the revenue remaining after deducting the cost of goods sold (COGS), provides a clear picture of a company’s efficiency in managing production costs and can highlight potential partnership opportunities for increased profitability. By understanding how to calculate and interpret this metric, you’ll gain valuable insights into a company’s financial health, strategic alliance potential, and overall business acumen.
1. What Is Gross Profit And Why Is It Important?
Gross Profit is a key indicator of a company’s financial health. It shows the earnings left after subtracting the Cost of Goods Sold (COGS) from net revenue, highlighting operational efficiency.
Gross profit is calculated by subtracting the cost of goods sold (COGS) from net revenue. COGS includes direct costs like materials and labor, while net revenue is the total income from sales. Understanding gross profit is vital because it reveals how efficiently a company manages its production costs. A higher gross profit indicates better cost control and pricing strategies. This metric is important for assessing a company’s profitability and operational efficiency, which is why businesses on platforms like income-partners.net use it to evaluate potential partnerships and growth opportunities.
- Key Takeaways:
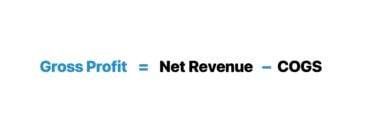
- Gross profit is the difference between net revenue and COGS.
- It’s found near the top of the income statement.
- Gross margin, calculated as gross profit divided by net revenue, allows for comparisons with industry peers.
2. How Is Gross Profit Calculated?
Gross profit is calculated by subtracting the Cost of Goods Sold (COGS) from net revenue. This simple calculation provides a direct view of a company’s profitability from its core operations.
The formula for gross profit is: Gross Profit = Net Revenue – Cost of Goods Sold (COGS). Net revenue is the total amount of money a company earns from selling its goods or services. COGS includes all direct costs associated with producing those goods or services, such as raw materials, direct labor, and manufacturing overhead. Indirect costs like selling, general, and administrative expenses (SG&A) and research and development (R&D) are not included in COGS. The resulting gross profit figure represents the income available to cover operating expenses and other business costs. A high gross profit is desirable, as it indicates that a company is efficiently managing its production costs. Gross profit insights are essential for making informed business decisions and are often a key consideration for partnerships facilitated through platforms like income-partners.net.
2.1. Components of the Gross Profit Formula
To calculate gross profit effectively, you need to understand the components of the formula: Net Revenue and Cost of Goods Sold (COGS). Net revenue is the total income from sales, while COGS includes all direct production costs.
- Net Revenue: This is the total income a company generates from its sales of goods or services. It is often referred to as the “top line” because it appears at the top of the income statement.
- Cost of Goods Sold (COGS): COGS includes all direct costs associated with producing the goods or services sold. This typically includes the cost of raw materials, direct labor, and manufacturing overhead.
2.2. Examples of Direct and Indirect Costs
Understanding the difference between direct and indirect costs is crucial for accurately calculating gross profit. Direct costs are directly tied to production, while indirect costs are not.
- Direct Costs: These costs are directly attributable to the production of goods or services. Examples include:
- Direct Materials: Raw materials used in production.
- Direct Labor: Wages paid to workers directly involved in production.
- Overhead Costs: Costs associated with the production facility, such as rent, utilities, and depreciation of equipment.
- Indirect Costs: These costs are not directly tied to production but are necessary for the overall operation of the business. Examples include:
- Selling, General, and Administrative (SG&A): Costs associated with marketing, sales, and administrative functions.
- Research and Development (R&D): Costs associated with developing new products or services.
2.3. How to Increase Gross Profit
Increasing gross profit can be achieved through several strategies, including raising average order value, reducing inventory costs, and leveraging economies of scale. These methods improve profitability.
There are four primary methods to increase a company’s gross profit:
- Increase Average Order Value (AOV):
- Requires effective pricing strategies and the ability to upsell or cross-sell products.
- Product bundling can also increase AOV.
- Reduce Inventory Purchase Prices:
- This requires strong buying power and negotiating leverage with suppliers.
- High order volume, frequent orders, and bulk purchases can help reduce prices.
- Higher Margin Per-Unit Sales:
- Integrating products or services with higher profit margins into existing offerings.
- Adding software capabilities to hardware products can improve pricing.
- Economies of Scale:
- Increased production and sales can reduce the incremental costs per unit.
- Larger operations can lead to more efficient use of resources.
3. What Is A Good Gross Profit Margin?
A “good” gross profit margin varies by industry, so benchmarking against industry peers is essential. Generally, a higher gross margin is better, indicating efficient cost management and higher profitability.
Classifying a company’s gross profit as “good” depends heavily on the industry it operates in and other contextual details. It’s essential to standardize the gross profit by dividing it by revenue to calculate the gross margin percentage: Gross Profit Margin (%) = Gross Profit ÷ Revenue. A higher gross margin is generally perceived positively, as it suggests a greater potential for a higher operating margin (EBIT) and net profit margin. Comparing gross margins should only be done among comparable companies to ensure an “apples-to-apples” comparison. Understanding what constitutes a good gross profit margin can guide businesses in making strategic decisions about pricing, cost management, and partnerships, all of which are vital for success in today’s competitive market.
3.1. Benchmarking Gross Profit Margin by Industry
Benchmarking gross profit margin by industry provides a context for evaluating a company’s financial performance. Different industries have different cost structures, affecting what is considered a good margin.
Gross profit margins vary significantly across industries. For example, software companies often have very high gross margins (e.g., 70-90%) due to low production costs. In contrast, retail companies typically have lower gross margins (e.g., 20-40%) due to higher costs of goods sold. Comparing a company’s gross margin to the industry average provides a more accurate assessment of its financial health. For instance, according to research from the University of Texas at Austin’s McCombs School of Business, in July 2025, software firms in Austin are expected to maintain gross margins around 80%, while retailers may average closer to 30%.
3.2. How Gross Margin Affects Operating and Net Profit Margins
Gross margin significantly impacts operating and net profit margins. A higher gross margin provides more room for covering operating expenses and achieving higher overall profitability.
The gross margin is a key determinant of a company’s overall profitability. A higher gross margin means there is more revenue available to cover operating expenses, such as selling, general, and administrative (SG&A) costs, as well as research and development (R&D) expenses. If a company has a low gross margin, it may struggle to cover these operating expenses, resulting in a lower operating profit margin and, ultimately, a lower net profit margin. Conversely, a high gross margin allows a company to invest more in growth initiatives and still maintain a healthy bottom line.
3.3. Using Gross Margin for Comparable Company Analysis
Gross margin is a useful metric for comparing companies within the same industry. It helps investors and analysts assess which companies are more efficient in managing their production costs.
Gross margin is a valuable tool for comparable company analysis because it standardizes profitability by expressing it as a percentage of revenue. This allows for meaningful comparisons even between companies of different sizes. By comparing the gross margins of companies within the same industry, analysts can identify which companies are more efficient in managing their production costs. This information can be used to make investment decisions or to identify potential partnership opportunities.
 Gross Profit Formula
4. Where Can You Find Gross Profit On The Income Statement?
Gross profit is located on the income statement, typically near the top. It is calculated after subtracting the Cost of Goods Sold (COGS) from net revenue, providing a clear view of initial profitability.
To find the gross profit on the income statement, look for the line item labeled “Gross Profit” or “Gross Income.” This line appears after “Net Revenue” (or “Sales”) and “Cost of Goods Sold (COGS).” The gross profit is the result of subtracting COGS from net revenue. The income statement follows a logical progression: it starts with revenue, deducts the direct costs associated with generating that revenue (COGS), and arrives at the gross profit. This figure represents the initial profit a company makes before accounting for operating expenses, interest, and taxes.
4.1. Step-by-Step Guide to Locating Gross Profit
Finding gross profit on the income statement involves a straightforward process. Here’s a step-by-step guide to help you locate it quickly and accurately.
- Obtain the Income Statement: The first step is to get a copy of the company’s income statement. This can usually be found in the company’s annual report (10-K for US companies) or quarterly report (10-Q).
- Locate Net Revenue: Start by finding the line item labeled “Net Revenue” or “Sales.” This is the total revenue generated by the company from its sales of goods or services.
- Find Cost of Goods Sold (COGS): Next, locate the line item labeled “Cost of Goods Sold” or “COGS.” This represents the direct costs associated with producing the goods or services sold.
- Identify Gross Profit: Look for the line item labeled “Gross Profit” or “Gross Income.” This is the result of subtracting COGS from net revenue. The formula is: Gross Profit = Net Revenue – COGS.
- Verify the Calculation: Double-check the calculation to ensure that the gross profit figure is accurate. Subtract COGS from net revenue to confirm that the result matches the reported gross profit.
4.2. Example Using Apple’s Income Statement
Using Apple’s income statement as an example, we can see how the gross profit is calculated. This helps illustrate how to find and interpret the metric in a real-world context.
Apple’s income statement provides a clear illustration of how gross profit is calculated. In their 2021 fiscal year, Apple reported net sales of $365.817 billion and a cost of sales of $212.981 billion. The gross profit is calculated as follows: Gross Profit = $365.817 billion – $212.981 billion = $152.836 billion. Apple’s income statement refers to gross profit as “gross margin,” but it represents the same figure. This example demonstrates how to locate and calculate gross profit using a real-world financial statement.
4.3. Why Companies Might Use Different Terminology
Companies may use different terminology for gross profit, such as “gross margin,” which can cause confusion. Understanding these variations is important for accurate financial analysis.
While most companies use the term “gross profit,” some may use “gross margin” to refer to the same dollar amount. It’s important to note that “gross margin” is more commonly used to refer to the gross profit margin, which is a percentage. However, some companies use “gross margin” interchangeably with “gross profit.” This can be confusing, so it’s important to carefully review the income statement and understand the context in which the terms are being used. Always ensure you are comparing like-for-like metrics when analyzing financial statements.
5. Gross Profit Vs. Net Income: What Are The Key Differences?
Gross profit and net income are both measures of profitability, but they differ in scope. Gross profit only considers the cost of goods sold (COGS), while net income accounts for all expenses.
The key difference between gross profit and net income lies in the expenses that are considered. Gross profit only accounts for the cost of goods sold (COGS), which includes direct costs like materials and labor. Net income, on the other hand, accounts for all expenses, including operating expenses (e.g., SG&A, R&D), interest, and taxes. Net income is often referred to as the “bottom line” because it represents the company’s profit after all expenses have been paid. While gross profit provides insight into a company’s production efficiency, net income provides a comprehensive view of overall profitability.
5.1. How Net Income Accounts for All Expenses
Net income provides a comprehensive view of a company’s profitability by accounting for all expenses, including operating, interest, and taxes. This makes it a more complete measure of financial performance.
Net income is calculated by subtracting all expenses from total revenue. This includes not only the cost of goods sold (COGS) but also operating expenses such as selling, general, and administrative (SG&A) expenses, research and development (R&D) expenses, interest expense, and taxes. Because net income accounts for all of these expenses, it provides a more complete picture of a company’s profitability than gross profit. Net income is often used by investors and analysts to assess a company’s overall financial performance.
5.2. Impact of Non-Operating Income and Expenses on Net Income
Non-operating income and expenses, such as interest income and expenses, can significantly impact net income. These items are not related to the core business operations but affect the bottom line.
Non-operating income and expenses can have a significant impact on net income. These items are not directly related to a company’s core business operations but can still affect its profitability. Examples of non-operating income include interest income, gains from the sale of assets, and dividend income. Examples of non-operating expenses include interest expense, losses from the sale of assets, and write-downs of inventory or equipment. These items are included in the calculation of net income, which can distort the picture of a company’s core business performance.
5.3. Which Metric Is Better for Peer-to-Peer Comparisons?
Gross profit is generally better for peer-to-peer comparisons because it is less affected by financing decisions and accounting policies than net income. This allows for a more accurate assessment of operational efficiency.
Gross profit is generally better suited for peer-to-peer comparisons because it is less affected by financing decisions and accounting policies. Net income can be distorted by factors such as interest expense, tax rates, and depreciation methods, which can vary significantly between companies. Gross profit, on the other hand, focuses solely on the direct costs of producing goods or services, providing a more accurate measure of operational efficiency. This makes it easier to compare companies within the same industry and assess their relative performance.
 Gross Profit Apple (AAPL) Example
6. How To Forecast Gross Profit Effectively?
Forecasting gross profit involves estimating future revenue and cost of goods sold (COGS). A common approach is to use the gross margin percentage based on historical data and industry benchmarks.
To forecast gross profit effectively, the most common approach is to assume a company’s gross margin (GM) percentage based on historical data and industry comparables. The forecasted gross profit is then calculated by multiplying the assumed gross margin percentage by the projected revenue. For example, if a company’s historical gross margin has been around 40% and revenue is projected to be $1 million next year, the forecasted gross profit would be $400,000. Another approach is to forecast COGS as a percentage of revenue and subtract it from the projected revenue to arrive at the gross profit. Accurate forecasting requires careful analysis of historical trends, industry dynamics, and company-specific factors.
6.1. Using Historical Data to Project Gross Margin
Historical data provides a solid foundation for projecting future gross margins. Analyzing past trends and performance helps in making informed estimates.
Using historical data to project gross margin involves analyzing a company’s past performance to identify trends and patterns. This can include looking at historical gross margins over the past few years, as well as factors that may have influenced those margins, such as changes in pricing, costs, or product mix. By analyzing this historical data, you can develop a reasonable estimate of what the company’s gross margin is likely to be in the future. It’s important to consider any factors that may cause the future gross margin to deviate from historical trends, such as changes in the competitive landscape or new product introductions.
6.2. Factoring in Industry Trends and Economic Conditions
Industry trends and economic conditions can significantly impact gross profit. Incorporating these factors into your forecast can improve accuracy.
Industry trends and economic conditions can have a significant impact on gross profit. For example, a growing industry may experience higher demand and pricing power, leading to higher gross margins. Conversely, an economic downturn may lead to lower demand and increased price competition, resulting in lower gross margins. It’s important to consider these factors when forecasting gross profit. This can involve researching industry reports, analyzing economic data, and consulting with industry experts to gain insights into the potential impact of these trends on the company’s gross profit.
6.3. Alternative Methods for Forecasting COGS
Besides projecting gross margin, alternative methods for forecasting COGS include analyzing cost drivers and using regression analysis. These methods offer different perspectives on cost forecasting.
In addition to projecting gross margin, there are several alternative methods for forecasting COGS. One approach is to analyze the underlying cost drivers, such as raw material prices, labor costs, and manufacturing overhead. By forecasting these individual cost components, you can develop a more detailed and accurate forecast of COGS. Another approach is to use regression analysis to identify the relationship between COGS and other variables, such as revenue, production volume, or input prices. This can help you develop a statistical model that can be used to forecast COGS based on changes in these variables.
7. Practical Gross Profit Calculation Example
Understanding how to calculate gross profit in a real-world scenario is essential. This section provides a step-by-step example using historical income statement data.
Let’s calculate the gross profit using Apple’s (AAPL) historical data from the past three fiscal years. This exercise will provide a practical understanding of how to apply the gross profit formula and analyze the results. The historical net sales and cost of sales data reported on Apple’s latest 10-K is shown in the table below.
| Apple (AAPL) Historical Data | |||
|---|---|---|---|
| ($ in millions) | 2019A | 2020A | 2021A |
| Net Sales: | |||
| Products | $213,883 | $220,747 | $297,392 |
| Services | 46,291 | 53,768 | 68,425 |
| Total Net Sales | $260,174 | $274,515 | $365,817 |
| Cost of Sales: | |||
| Products | ($144,996) | ($151,286) | ($192,266) |
| Services | (16,786) | (18,273) | (20,715) |
| Total Cost of Sales | ($161,782) | ($169,559) | ($212,981) |
7.1. Analyzing Apple’s Gross Profit by Division
Breaking down Apple’s gross profit by its Products and Services divisions provides deeper insights into the company’s profitability drivers.
To gain a deeper understanding of Apple’s profitability, we can analyze the gross profit and gross margin metrics separately for the Products and Services divisions:
Apple (AAPL) – Products Division:
- Gross Profit, 2019A = $213,883 million – $144,996 million = $68,887 million (32.2% Gross Margin)
- Gross Profit, 2020A = $220,747 million – $151,286 million = $69,461 million (31.5% Gross Margin)
- Gross Profit, 2021A = $297,392 million – $192,266 million = $105,126 million (35.3% Gross Margin)
Apple (AAPL) – Services Division:
- Gross Profit, 2019A = $46,291 million – $16,786 million = $29,505 million (63.7% Gross Margin)
- Gross Profit, 2020A = $53,768 million – $18,273 million = $35,495 million (66.0% Gross Margin)
- Gross Profit, 2021A = $68,425 million – $20,715 million = $47,710 million (69.7% Gross Margin)
7.2. Calculating Total Gross Profit and Gross Margin
Calculating the total gross profit and gross margin for Apple provides an overview of the company’s overall profitability performance.
Here’s the calculation for Apple’s total gross profit and gross margin:
Apple (AAPL) – Total Gross Profit:
- Gross Profit, 2019A = $260,174 million – $161,782 million = $98,392 million (37.8% Gross Margin)
- Gross Profit, 2020A = $274,515 million – $169,559 million = $104,956 million (38.2% Gross Margin)
- Gross Profit, 2021A = $365,817 million – $212,981 million = $152,836 million (41.8% Gross Margin)
7.3. Interpreting the Results and Trends
Interpreting the results and trends in gross profit and margin helps in understanding the company’s financial health and potential for future growth.
From 2019 to 2021, Apple’s gross margin averaged approximately 39%. The analysis shows that the company’s margins are particularly weighted down by the “Products” division. Generally, the gross profits kept by a technology company such as Apple (AAPL) tend to be higher for “Services” relative to “Products”, which can be confirmed by Apple’s historical gross margin in the trailing three fiscal years. This trend reflects the higher profitability of services compared to physical products, which is common in the tech industry. These insights are valuable for making informed investment decisions and assessing the potential for partnerships and growth.
 Gross Profit Calculator
8. What Kind Of Questions Should I Ask Myself About Gross Profit?
Understanding gross profit involves asking critical questions about its trends, drivers, and implications. These questions can help in assessing a company’s financial health and future prospects.
Asking the right questions about gross profit is crucial for a thorough financial analysis. These questions help reveal underlying trends, assess the effectiveness of cost management, and understand the implications for future profitability. Here are some key questions to consider:
8.1. What Are Key Considerations About Gross Profit?
Understanding the key considerations regarding gross profit can help in evaluating a company’s operational efficiency and profitability.
- What is the trend in gross profit over the past few years? Is it increasing, decreasing, or stable?
- How does the company’s gross profit margin compare to its industry peers? Is it higher, lower, or about the same?
- What are the main drivers of the company’s gross profit? Are they related to changes in revenue, cost of goods sold, or both?
- How sensitive is the company’s gross profit to changes in key variables, such as raw material prices or sales volume?
- What strategies is the company using to improve its gross profit? Are they focused on increasing revenue, reducing costs, or both?
8.2. What Does Gross Profit Reveal?
Gross profit reveals insights into a company’s operational efficiency, cost management, and pricing strategies. It also highlights potential areas for improvement.
- How efficient is the company in managing its production costs?
- What is the impact of pricing strategies on profitability?
- Are there opportunities to reduce costs without sacrificing quality?
- What is the composition of the cost of goods sold (COGS)?
- How does the company’s product or service mix affect gross profit?
8.3. What Are Some Strategic Moves Associated With Gross Profit?
Strategic moves associated with gross profit include pricing optimization, cost reduction, and supply chain management. These strategies can significantly impact profitability.
- Can the company increase prices without losing customers?
- Are there opportunities to negotiate better terms with suppliers?
- How can the company optimize its supply chain to reduce costs?
- Can the company improve its inventory management to reduce waste?
- Are there opportunities to outsource certain production activities to lower-cost providers?
9. What Are The Key Financial Ratios Related To Gross Profit?
Key financial ratios related to gross profit, such as gross margin, provide insights into a company’s profitability and efficiency.
Several financial ratios are closely related to gross profit and provide insights into a company’s profitability and efficiency. These ratios help in assessing a company’s financial health and identifying areas for improvement. The main ratio is:
9.1. Primary Financial Ratios Related To Gross Profit
Understanding the primary financial ratios related to gross profit can help in evaluating a company’s financial performance and identifying potential areas for improvement.
Gross Profit Margin:
- Formula: (Gross Profit / Revenue) x 100
- Interpretation: This ratio measures the percentage of revenue remaining after deducting the cost of goods sold (COGS). A higher gross profit margin indicates that a company is efficiently managing its production costs and pricing its products or services effectively.
- Example: If a company has a gross profit of $500,000 and revenue of $1,000,000, its gross profit margin is (500,000 / 1,000,000) x 100 = 50%.
9.2. How To Use The Ratio Correctly
Using financial ratios correctly involves comparing them to industry benchmarks, historical data, and understanding their limitations. This provides a comprehensive view of financial performance.
To use financial ratios correctly, it’s essential to compare them to industry benchmarks and historical data. This helps in understanding whether a company’s performance is above or below average and whether it’s improving or declining over time. Additionally, it’s important to understand the limitations of financial ratios and consider other factors, such as industry trends and economic conditions, when evaluating a company’s financial performance.
9.3. What Are The Limitations To Understand
Understanding the limitations of financial ratios, such as their reliance on historical data and potential for manipulation, is crucial for accurate analysis.
Financial ratios are based on historical data, which may not be indicative of future performance. They can also be manipulated by management through accounting choices. Additionally, financial ratios don’t provide a complete picture of a company’s financial health and should be used in conjunction with other information, such as qualitative factors and industry analysis. For example, according to research from Harvard Business Review, relying solely on financial ratios without understanding the underlying business model can lead to flawed investment decisions.
10. What Partnership Opportunities Can Arise From Gross Profit Analysis?
Gross profit analysis can reveal opportunities for strategic partnerships, such as collaborations to reduce costs or expand market reach.
Gross profit analysis can uncover opportunities for strategic partnerships that drive revenue and profitability. By identifying areas where costs can be reduced or market reach expanded, companies can form alliances that leverage each other’s strengths and create mutual benefits. These partnerships can be instrumental in achieving sustainable growth and competitive advantage.
10.1. Identifying Cost Reduction Opportunities
Partnerships aimed at reducing costs can significantly improve gross profit. Collaborating with suppliers or sharing resources can lead to greater efficiency and lower expenses.
Identifying cost reduction opportunities through partnerships can significantly improve gross profit. Collaborating with suppliers to negotiate better terms, pooling resources to achieve economies of scale, or sharing best practices to improve efficiency can all lead to lower costs of goods sold (COGS) and higher gross margins. These partnerships can create a win-win situation where both companies benefit from the cost savings.
10.2. Expanding Market Reach Through Partnerships
Strategic alliances can expand market reach and increase revenue, leading to higher gross profit. Collaborating on marketing, sales, or distribution can open new markets and customer segments.
Expanding market reach through partnerships can lead to higher revenue and gross profit. Collaborating on marketing and sales initiatives, sharing distribution networks, or jointly developing new products or services can all help companies reach new customers and markets. These partnerships can be particularly valuable for companies looking to expand internationally or enter new market segments.
10.3. Leveraging Core Competencies for Mutual Benefit
Partnerships that leverage core competencies can create synergistic benefits, leading to improved gross profit for both parties. Combining strengths can result in innovative solutions and greater efficiency.
Leveraging core competencies through partnerships can create synergistic benefits that improve gross profit for both parties. By combining their unique strengths and capabilities, companies can develop innovative solutions, improve efficiency, and create new revenue streams. For example, a technology company might partner with a manufacturing company to develop a new product, or a marketing company might partner with a sales organization to reach new customers. These partnerships can create a competitive advantage and drive long-term growth.
Are you ready to unlock the power of strategic partnerships and elevate your business’s financial performance? Visit income-partners.net today to explore diverse partnership opportunities, discover effective relationship-building strategies, and connect with potential collaborators across the USA. Our platform offers valuable insights into various partnership models, expert advice on negotiating beneficial agreements, and tools to measure and optimize partnership effectiveness. Address your challenges in finding the right partners, building trust, and managing long-term relationships with our comprehensive resources. Join income-partners.net now and start building profitable alliances that drive your success. Contact us at Address: 1 University Station, Austin, TX 78712, United States, or Phone: +1 (512) 471-3434.