Are you looking for ways to assess a company’s profitability and make informed investment decisions? Earnings Per Share (EPS) can show how lucrative a company is. In this guide, income-partners.net will explore how to find EPS on an income statement, understand its significance, and use it to identify potential partnership opportunities that drive income growth.
1. What Is Earnings Per Share (EPS)?
Earnings Per Share (EPS) measures a company’s profitability by indicating the portion of a company’s profit allocated to each outstanding share of common stock. In essence, it shows how much money shareholders would receive for each share if the company distributed all of its net income.
Earnings per share (EPS) represents a company’s net earnings attributable to common shareholders, shown on a per-share basis, with adjustments made for preferred stock dividends. A higher EPS generally signals greater profitability, while a lower EPS might indicate financial challenges.
 Earnings Per Share (EPS)
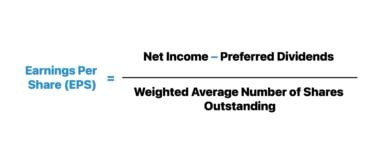
The EPS is calculated as follows:
EPS = (Net Income – Preferred Dividends) / Weighted Average Common Shares Outstanding
According to research from the University of Texas at Austin’s McCombs School of Business, a consistently increasing EPS over several years often indicates strong financial management and growth potential.
2. Why Is Earnings Per Share (EPS) Important?
EPS is a critical financial metric for several reasons:
- Profitability Indicator: EPS provides a clear picture of a company’s profitability on a per-share basis, making it easy to compare with other companies.
- Investment Analysis: Investors use EPS to assess whether a stock is overvalued or undervalued.
- Performance Evaluation: EPS helps evaluate a company’s performance over time, showing whether profits are increasing or decreasing.
- Credibility: A company with a high EPS signals credibility.
For instance, a steadily increasing EPS can be a strong indicator of a company’s financial health and growth potential, making it an attractive partner for income-generating ventures.
3. What Are the Different Types of Earnings Per Share?
There are two main types of EPS:
-
Basic EPS: This calculation uses the company’s net income available to common shareholders divided by the weighted average number of common shares outstanding during the period.
Basic EPS = (Net Income – Preferred Dividends) / Weighted Average Common Shares Outstanding
-
Diluted EPS: This calculation includes the potential dilution of earnings if all stock options, warrants, and convertible securities were exercised. This provides a more conservative view of EPS.
Diluted EPS = (Net Income – Preferred Dividends) / (Weighted Average Common Shares Outstanding + Potential Dilutive Shares)
Diluted EPS is always less than basic EPS because it accounts for the increase in shares outstanding if all dilutive securities are converted into common stock. According to Harvard Business Review, companies with a significant difference between basic and diluted EPS may face pressure on future earnings if dilutive securities are exercised.
4. How Do You Find EPS on the Income Statement?
To locate EPS on an income statement, follow these steps:
- Obtain the Income Statement: Get the company’s income statement, typically available in its quarterly or annual reports (10-Q or 10-K filings).
- Locate the EPS Section: Look for a section labeled “Earnings Per Share” or similar near the bottom of the income statement, generally after the Net Income figure.
- Identify Basic and Diluted EPS: The income statement will typically present both basic and diluted EPS figures.
- Note the Share Count: The weighted average number of common shares outstanding (used to calculate basic EPS) and the weighted average number of diluted shares outstanding (used to calculate diluted EPS) are usually listed alongside the EPS figures.
5. Where Can I Find Real-Life Examples of EPS?
You can find real-life examples of EPS in the financial reports of publicly traded companies. Here are a few resources:
- Company Investor Relations Websites: Most companies have an investor relations section on their websites where you can download annual and quarterly reports.
- SEC Filings: The U.S. Securities and Exchange Commission (SEC) maintains a database of company filings called EDGAR (Electronic Data Gathering, Analysis, and Retrieval system).
- Financial News Websites: Websites such as Yahoo Finance, Google Finance, and Bloomberg provide financial data, including EPS, for publicly traded companies.
6. What Does a High or Low EPS Indicate?
- High EPS: A high EPS generally indicates that a company is profitable and efficient at generating earnings for its shareholders.
- Low EPS: A low EPS might suggest that a company is struggling to generate profits or that its earnings are spread thinly across a large number of outstanding shares.
7. How Do Stock Buybacks and Share Issuances Affect EPS?
Stock buybacks and share issuances can significantly impact EPS:
- Stock Buybacks: When a company buys back its shares, it reduces the number of outstanding shares. This reduction increases EPS, as the same amount of net income is now divided by fewer shares. According to Entrepreneur.com, stock buybacks can artificially inflate EPS, making the company appear more profitable.
- Share Issuances: When a company issues new shares, it increases the number of outstanding shares. This increase decreases EPS, as the same amount of net income is now divided by more shares. Share issuances can dilute earnings, which may negatively impact shareholder value.
8. How Does a Stock Split Impact the EPS Ratio?
A stock split is when a company increases the number of its shares outstanding by issuing more shares to current shareholders. While the market capitalization remains the same, a stock split affects the EPS ratio:
- Stock Split: In a stock split, the number of shares increases, and the EPS decreases proportionally. For instance, in a 2-for-1 stock split, the number of shares doubles, and the EPS is halved.
9. What Are the Limitations of Using EPS?
While EPS is a valuable metric, it has limitations:
- Accounting Practices: EPS can be influenced by different accounting practices, making comparisons between companies difficult.
- Capital Structure: EPS does not consider a company’s capital structure or debt levels, which can affect its financial risk.
- Non-Cash Items: EPS includes non-cash items like depreciation, which may not accurately reflect a company’s cash flow.
10. How Can You Use EPS to Identify Potential Partnership Opportunities?
When considering potential partnership opportunities, EPS can be a valuable tool:
- Assess Profitability: Look for companies with a consistently increasing EPS, indicating strong profitability and growth potential.
- Compare with Industry Peers: Compare a company’s EPS with its industry peers to gauge its relative performance.
- Evaluate Financial Health: Analyze both basic and diluted EPS to understand the potential impact of dilutive securities on future earnings.
- Consider Trends: Examine EPS trends over several years to identify companies with a track record of consistent growth.
To further enhance your ability to assess potential partnership opportunities, consider utilizing income-partners.net. It offers a wide range of tools and resources to help you identify and evaluate potential partners, ensuring you make informed decisions that align with your business goals.
11. What Is a Good EPS Ratio?
Determining what constitutes a “good” EPS ratio requires context and comparison. Here are some guidelines:
- Compare to Industry Peers: An EPS significantly higher than the industry average indicates a company’s superior profitability.
- Compare to Historical EPS: A rising trend in EPS over several years suggests improving profitability and efficiency.
- Consider the P/E Ratio: A high EPS combined with a reasonable P/E ratio suggests the company’s stock may be undervalued.
12. How Do You Calculate Weighted Average Shares Outstanding?
The weighted average shares outstanding is a crucial component of the EPS calculation. It accounts for changes in the number of shares during the reporting period due to issuances or buybacks. Here’s how to calculate it:
- Determine the Number of Shares Outstanding: Identify the number of shares outstanding at the beginning of the period and any changes during the period.
- Weight the Shares by Time: Multiply the number of shares outstanding by the fraction of the year they were outstanding.
- Sum the Weighted Shares: Add up the weighted shares to arrive at the weighted average shares outstanding.
For example, if a company had 1 million shares outstanding for the first six months and then issued an additional 500,000 shares, the weighted average would be calculated as follows:
- (1,000,000 shares * 0.5 year) + (1,500,000 shares * 0.5 year) = 1,250,000 shares
13. What Is the Treasury Stock Method (TSM)?
The Treasury Stock Method (TSM) is used to calculate the potential dilution from stock options and warrants when calculating diluted EPS. The method assumes that any proceeds received by the company from the exercise of these options and warrants would be used to repurchase shares of the company’s stock at the average market price during the period.
- Determine the Number of Options and Warrants: Identify all outstanding options and warrants that could potentially be exercised.
- Calculate the Proceeds from Exercise: Multiply the number of options and warrants by their exercise price.
- Determine the Number of Shares Repurchased: Divide the proceeds by the average market price of the stock during the period.
- Calculate the Net Dilution: Subtract the number of shares repurchased from the number of shares that would be issued upon exercise of the options and warrants.
- Add the Net Dilution to the Weighted Average Shares Outstanding: This gives the diluted weighted average shares outstanding.
14. How Do You Interpret Negative Earnings Per Share (EPS)?
A negative EPS indicates that a company has incurred a net loss. This means the company’s expenses exceeded its revenues, resulting in a loss for each outstanding share. Interpreting a negative EPS requires careful analysis:
- Assess the Reason for the Loss: Determine the cause of the loss. Was it due to a one-time event, such as a major restructuring or impairment charge, or is it indicative of ongoing operational issues?
- Evaluate the Company’s Financial Health: Look at other financial metrics, such as revenue trends, cash flow, and debt levels, to get a more comprehensive picture of the company’s financial health.
- Consider Industry Trends: Compare the company’s performance to its industry peers. Is the entire industry facing challenges, or is the company underperforming its competitors?
- Review Management’s Outlook: Pay attention to management’s commentary on the reasons for the loss and their plans to return the company to profitability.
15. How to Account for Preferred Dividends in EPS Calculation?
Preferred dividends are subtracted from net income when calculating EPS because EPS measures the earnings available to common shareholders. Preferred shareholders have a higher claim on earnings than common shareholders, so their dividends must be paid before any earnings can be allocated to common shares.
- Identify Preferred Dividends: Determine the amount of preferred dividends paid during the period. This information can be found on the income statement or in the notes to the financial statements.
- Subtract Preferred Dividends from Net Income: Subtract the preferred dividends from the company’s net income to arrive at the earnings available to common shareholders.
- Calculate EPS: Divide the earnings available to common shareholders by the weighted average number of common shares outstanding.
For example, if a company has a net income of $1 million and pays $200,000 in preferred dividends, the earnings available to common shareholders would be $800,000. If the company has 500,000 common shares outstanding, the EPS would be:
- $800,000 / 500,000 = $1.60 per share
16. What Are Some Strategies for Improving EPS?
Improving EPS is a key goal for many companies, as it can lead to increased stock prices and shareholder value. Here are some strategies companies can use to improve their EPS:
- Increase Revenue: Growing revenue is one of the most straightforward ways to improve EPS. Companies can focus on increasing sales volume, expanding into new markets, or launching new products and services.
- Reduce Costs: Cutting costs can boost net income and, consequently, EPS. Companies can look for efficiencies in their operations, negotiate better deals with suppliers, or streamline their processes.
- Stock Buybacks: As mentioned earlier, repurchasing shares reduces the number of outstanding shares, which increases EPS.
- Improve Operational Efficiency: Improving efficiency can lead to higher profit margins. Companies can invest in technology, training, and process improvements to boost productivity and reduce waste.
- Manage Debt: Reducing debt can lower interest expenses, which increases net income. Companies can refinance their debt at lower rates or use excess cash flow to pay down debt.
17. How Can You Use EPS to Compare Companies in Different Industries?
Comparing EPS across different industries can be challenging because profitability levels and capital structures vary significantly. However, here are some strategies to make more meaningful comparisons:
- Focus on Industry-Specific Metrics: Instead of relying solely on EPS, consider industry-specific metrics that provide a more accurate picture of performance. For example, in the retail industry, same-store sales growth is a key indicator, while in the technology industry, revenue per employee is often used.
- Compare to Industry Averages: Compare a company’s EPS to the average EPS for its industry. This can help you assess whether the company is outperforming or underperforming its peers.
- Consider Growth Rates: Look at the growth rate of EPS over time, rather than just the absolute value. A company with a lower EPS but a higher growth rate may be a more attractive investment than a company with a higher EPS but a slower growth rate.
- Use Relative Valuation Ratios: Use valuation ratios that adjust for differences in capital structure and profitability. For example, the price-to-earnings growth (PEG) ratio compares a company’s P/E ratio to its EPS growth rate, providing a more comprehensive view of its valuation.
18. How Do Extraordinary Items Affect EPS?
Extraordinary items are unusual and infrequent events that can significantly impact a company’s net income and EPS. These items can include things like:
- Restructuring Charges: Costs associated with reorganizing a company’s operations, such as severance payments and facility closures.
- Impairment Charges: Write-downs of assets when their carrying value exceeds their fair value.
- Gains or Losses from Asset Sales: Profits or losses from selling significant assets, such as real estate or subsidiaries.
- Natural Disasters: Costs associated with damage from events like hurricanes or earthquakes.
19. How Can You Forecast Future EPS?
Forecasting future EPS can be a useful exercise for investors and analysts, but it requires making assumptions about future revenue growth, cost control, and share repurchases. Here are some common approaches:
- Top-Down Approach: Start with an overall economic forecast and then estimate how the company’s industry and the company itself will perform. Consider factors like GDP growth, inflation, and consumer spending.
- Bottom-Up Approach: Build a detailed model of the company’s revenue and expenses, based on historical data and management’s guidance. Make assumptions about future sales growth, cost of goods sold, operating expenses, and interest expense.
- Analyst Estimates: Review EPS estimates from Wall Street analysts. These estimates are often based on a combination of top-down and bottom-up analysis and can provide a useful benchmark.
- Sensitivity Analysis: Perform sensitivity analysis to see how changes in key assumptions, such as revenue growth or profit margins, would impact the EPS forecast.
 EPS Calculator
20. What Are Common Mistakes to Avoid When Analyzing EPS?
Analyzing EPS can be a useful tool for evaluating a company’s profitability, but it’s important to avoid common mistakes that can lead to flawed conclusions:
- Ignoring Diluted EPS: Always consider diluted EPS, which accounts for potential dilution from stock options, warrants, and convertible securities. Basic EPS can be misleading if a company has a significant number of dilutive securities outstanding.
- Focusing Solely on EPS: EPS should not be the only metric you consider. Look at other financial ratios and metrics, such as revenue growth, profit margins, cash flow, and debt levels, to get a more comprehensive picture of the company’s financial health.
- Comparing EPS Across Different Industries: Profitability levels and capital structures vary significantly across industries, making it difficult to compare EPS directly. Focus on industry-specific metrics and compare a company’s EPS to its industry peers.
- Ignoring Extraordinary Items: Extraordinary items can distort a company’s net income and EPS. Be sure to understand the nature and impact of these items before drawing conclusions about the company’s underlying profitability.
- Failing to Consider the Quality of Earnings: A company can manipulate its earnings through accounting practices. Look for signs of aggressive accounting or unsustainable practices that could inflate EPS in the short term but lead to problems down the road.
- Overlooking the Impact of Stock Buybacks: Stock buybacks can artificially inflate EPS by reducing the number of outstanding shares. Consider the impact of buybacks when evaluating a company’s EPS growth.
- Relying Solely on Historical Data: While historical data can provide valuable insights, it’s important to consider future growth prospects and potential changes in the company’s business environment.
FAQ About Earnings Per Share (EPS)
- What is a good EPS for a company? A “good” EPS varies by industry and company size, but generally, a higher EPS compared to industry peers is favorable.
- Is a higher or lower EPS better? A higher EPS is generally better as it indicates greater profitability per share.
- What does it mean if a company has negative EPS? Negative EPS indicates the company experienced a net loss rather than a profit.
- How is EPS used in stock valuation? EPS is a key component in calculating the Price-to-Earnings (P/E) ratio, which helps investors determine if a stock is over or undervalued.
- What is the difference between EPS and revenue? Revenue is the total income a company generates, while EPS is the portion of net income allocated to each outstanding share.
- Can EPS be manipulated? Yes, companies can use accounting practices or stock buybacks to manipulate EPS.
- How do stock splits affect EPS? Stock splits decrease EPS because the number of shares outstanding increases.
- Why is diluted EPS important? Diluted EPS provides a more conservative view by including potential dilution from stock options and convertible securities.
- Where can I find a company’s EPS? EPS is usually listed near the bottom of the income statement in a company’s financial reports.
- How does debt affect EPS? Higher debt can decrease EPS due to interest expenses, reducing net income.
Conclusion
Understanding how to find EPS on an income statement is crucial for assessing a company’s financial health and identifying potential partnership opportunities. By using EPS in conjunction with other financial metrics and resources like income-partners.net, you can make informed decisions that drive income growth and business success. Remember to analyze both basic and diluted EPS, consider industry trends, and evaluate the quality of earnings to gain a comprehensive understanding of a company’s profitability.
Ready to take your business partnerships to the next level? Visit income-partners.net today to discover a wealth of resources, strategies, and opportunities for building profitable collaborations and driving sustainable income growth. Explore the potential for mutually beneficial relationships that align with your business goals and secure long-term success.