How are the balance sheet, income statement, and cash flow related? Understanding the interplay between these financial statements is crucial for making informed business decisions and spotting potential partnership opportunities that boost your income. At income-partners.net, we’ll explore how these statements connect and why they matter for strategic collaborations. Discover how to leverage this knowledge to find partners who can enhance your financial performance, create robust business relationships, and identify lucrative prospects.
1. Understanding the Core Financial Statements
To grasp how the balance sheet, income statement, and cash flow statement are related, it’s essential to first understand what each statement represents individually. These three statements provide a comprehensive view of a company’s financial health. Let’s break down each one:
1.1. The Income Statement (Profit and Loss Statement)
The Income Statement, also known as the Profit and Loss (P&L) statement, presents a company’s financial performance over a specific period, such as a quarter or a year. It starts with revenue, subtracts costs and expenses, and arrives at net income, also known as the bottom line. This statement is crucial for evaluating a company’s profitability.
| Key Components of the Income Statement | Description |
|---|---|
| Revenue | The total amount of money a company receives from its operations. |
| Cost of Goods Sold (COGS) | The direct costs of producing goods or services. |
| Gross Profit | Revenue minus COGS, indicating the profitability of core operations. |
| Operating Expenses | Expenses incurred in running the business, such as salaries, rent, and marketing. |
| Operating Income | Gross profit minus operating expenses, reflecting the profitability of the business before interest and taxes. |
| Interest Expense | The cost of borrowing money. |
| Income Tax Expense | The amount of taxes a company owes on its income. |
| Net Income | The final profit after all expenses and taxes have been deducted from revenue. |
For entrepreneurs and business owners, understanding the income statement is vital for identifying areas where costs can be reduced and revenue can be increased, enhancing overall profitability.
1.2. The Balance Sheet (Statement of Financial Position)
The Balance Sheet provides a snapshot of a company’s assets, liabilities, and equity at a specific point in time. It follows the fundamental accounting equation:
Assets = Liabilities + Equity
- Assets: What a company owns, such as cash, accounts receivable, and property, plant, and equipment (PP&E).
- Liabilities: What a company owes to others, such as accounts payable, salaries payable, and debt.
- Equity: The owners’ stake in the company, representing the residual interest in the assets after deducting liabilities.
| Components of the Balance Sheet | Description |
|---|---|
| Assets | |
| Current Assets | Assets that can be converted into cash within one year, such as cash, accounts receivable, and inventory. |
| Non-Current Assets | Assets with a life of more than one year, such as property, plant, and equipment (PP&E) and intangible assets. |
| Liabilities | |
| Current Liabilities | Obligations due within one year, such as accounts payable, salaries payable, and short-term debt. |
| Non-Current Liabilities | Obligations due in more than one year, such as long-term debt and deferred tax liabilities. |
| Equity | |
| Common Stock | The par value of shares issued by the company. |
| Retained Earnings | The accumulated profits of the company that have not been distributed as dividends. |
According to research from the University of Texas at Austin’s McCombs School of Business, analyzing the balance sheet helps investors and business owners assess a company’s financial structure, liquidity, and solvency.
1.3. The Cash Flow Statement (Statement of Cash Flows)
The Cash Flow Statement (CFS) tracks the movement of cash both into and out of a company during a specific period. It categorizes cash flows into three main activities:
- Operating Activities: Cash flows resulting from the normal day-to-day business operations.
- Investing Activities: Cash flows related to the purchase and sale of long-term assets, such as property, plant, and equipment (PP&E).
- Financing Activities: Cash flows related to debt, equity, and dividends.
| Sections of the Cash Flow Statement | Description |
|---|---|
| Operating Activities | |
| Net Income | The starting point, adjusted for non-cash items. |
| Depreciation and Amortization | Non-cash expenses added back to net income. |
| Changes in Working Capital | Adjustments for changes in current assets and liabilities. |
| Investing Activities | |
| Capital Expenditures (Capex) | Cash spent on purchasing or upgrading long-term assets. |
| Proceeds from Asset Sales | Cash received from selling long-term assets. |
| Financing Activities | |
| Proceeds from Debt | Cash received from borrowing money. |
| Repayment of Debt | Cash spent on repaying loans. |
| Proceeds from Equity Issuance | Cash received from issuing new shares. |
| Dividends Paid | Cash distributed to shareholders. |
Entrepreneurs and investors use the cash flow statement to evaluate a company’s ability to generate cash, meet its obligations, and fund its investments.
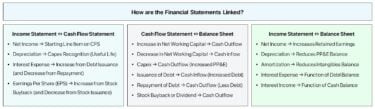 How are the Financial Statements Linked
2. Key Connections Between Financial Statements
The three financial statements are interdependent, with information flowing between them to provide a holistic view of a company’s financial performance and position. Understanding these connections is vital for anyone seeking partnership opportunities and aiming to boost their income.
2.1. The Link Between the Income Statement and Cash Flow Statement
Net income from the income statement serves as the starting point for the cash flow statement under the indirect method. Here’s how they connect:
- Net Income Adjustment: The cash flow statement reconciles net income by adjusting for non-cash items, such as depreciation and amortization (D&A), and changes in working capital to arrive at cash from operations (CFO).
- Non-Cash Expenses: Depreciation, amortization, and stock-based compensation are added back to net income because they reduce net income but do not involve an actual cash outflow.
- Changes in Working Capital: Changes in current assets and liabilities, such as accounts receivable and accounts payable, affect cash flow. An increase in accounts receivable, for example, reduces cash flow because the company has made sales on credit but hasn’t yet received the cash.
Example:
Let’s say a company has a net income of $500,000. It also has depreciation expenses of $50,000 and an increase in accounts receivable of $20,000. The cash from operations would be calculated as follows:
Cash from Operations = Net Income + Depreciation – Increase in Accounts Receivable
Cash from Operations = $500,000 + $50,000 – $20,000 = $530,000
2.2. The Link Between the Cash Flow Statement and Balance Sheet
The cash flow statement impacts several balance sheet accounts. Here are some key connections:
- Cash Balance: The ending cash balance on the cash flow statement is reflected as the cash balance on the balance sheet.
- Capital Expenditures (Capex): Purchases of property, plant, and equipment (PP&E) are recorded as cash outflows in the investing activities section of the cash flow statement. These purchases increase the PP&E balance on the balance sheet.
- Debt and Equity: Proceeds from debt and equity issuances are recorded as cash inflows in the financing activities section of the cash flow statement. These issuances increase the debt and equity balances on the balance sheet.
Example:
If a company purchases equipment for $100,000, this transaction will be recorded as a cash outflow in the investing activities section of the cash flow statement. The PP&E balance on the balance sheet will increase by $100,000.
2.3. The Link Between the Income Statement and Balance Sheet
The income statement and balance sheet are connected through retained earnings. Here’s how:
-
Retained Earnings: Net income from the income statement increases the retained earnings balance on the balance sheet. Dividends paid to shareholders decrease retained earnings. The formula is:
Ending Retained Earnings = Beginning Retained Earnings + Net Income – Dividends
-
Depreciation: Depreciation expense on the income statement reduces the book value of fixed assets (PP&E) on the balance sheet.
-
Interest Expense: Interest expense on the income statement is related to the debt balance on the balance sheet. The higher the debt, the higher the interest expense, impacting net income.
Example:
If a company has a net income of $200,000 and pays dividends of $50,000, the retained earnings balance on the balance sheet will increase by $150,000.
3. The Importance of Understanding These Connections
Understanding how the balance sheet, income statement, and cash flow statement are related is crucial for:
- Financial Analysis: A thorough understanding of these connections allows for a more accurate assessment of a company’s financial health, performance, and sustainability.
- Investment Decisions: Investors can use this knowledge to make informed decisions about where to allocate capital.
- Strategic Partnerships: Businesses seeking partnerships can evaluate potential partners more effectively by analyzing their financial statements and understanding how their operations impact their financial position.
According to Harvard Business Review, companies that prioritize financial literacy and analysis are better positioned to make strategic decisions and achieve long-term success.
4. Analyzing the Financial Statements for Partnership Opportunities
When evaluating potential partnership opportunities, it’s essential to analyze the financial statements of potential partners. Here are some key areas to focus on:
4.1. Profitability and Revenue Growth
- Income Statement: Look for consistent revenue growth and healthy profit margins. A company with strong revenue growth and profitability is more likely to be a valuable partner.
- Example: A potential partner with a steady increase in revenue and a gross profit margin above the industry average is a good sign.
4.2. Financial Stability and Liquidity
- Balance Sheet: Assess the company’s financial stability by examining its debt levels, cash reserves, and equity. A company with a strong balance sheet is less likely to face financial distress.
- Cash Flow Statement: Evaluate the company’s ability to generate cash from its operations. Positive cash flow from operations indicates that the company can fund its activities without relying heavily on external financing.
- Example: A partner with a low debt-to-equity ratio and a healthy cash balance is financially stable.
4.3. Efficiency and Operational Effectiveness
- Ratio Analysis: Use financial ratios to assess the company’s efficiency and operational effectiveness. Key ratios include:
- Return on Assets (ROA): Net Income / Total Assets
- Return on Equity (ROE): Net Income / Total Equity
- Inventory Turnover: Cost of Goods Sold / Average Inventory
- Accounts Receivable Turnover: Revenue / Average Accounts Receivable
- Example: A potential partner with high ROA and efficient inventory turnover is effectively managing its assets and operations.
4.4. Sustainability and Growth Potential
- Trend Analysis: Analyze the trends in the company’s financial performance over time. Look for consistent improvements in revenue, profitability, and cash flow.
- Strategic Initiatives: Evaluate the company’s strategic initiatives and growth plans. A company with a clear vision and a solid plan for future growth is more likely to be a valuable partner.
- Example: A company that consistently invests in research and development and expands into new markets is positioning itself for long-term growth.
5. Practical Applications and Examples
To illustrate the importance of understanding the connections between financial statements, let’s consider a few practical examples.
5.1. Scenario 1: Evaluating a Potential Distribution Partner
Imagine you are a manufacturer of high-quality organic snacks and are looking for a distribution partner to expand your reach in the U.S. market. You identify a potential partner, “Healthy Distribution Co.,” and obtain their financial statements for the past three years.
Analysis:
- Income Statement: You notice that Healthy Distribution Co. has consistently increased its revenue by 15% annually. However, their net profit margin has declined from 8% to 5% due to rising operating expenses.
- Balance Sheet: The company’s debt-to-equity ratio has increased significantly over the past three years, indicating higher financial risk.
- Cash Flow Statement: While the company has positive cash flow from operations, it has been investing heavily in new warehouses and distribution centers.
Conclusion:
While Healthy Distribution Co. has shown strong revenue growth, its declining profitability and increasing debt levels raise concerns. You decide to conduct further due diligence to assess the sustainability of their growth and their ability to manage their debt.
5.2. Scenario 2: Assessing a Potential Technology Partner
You run a marketing agency and are considering partnering with a technology company, “Tech Solutions Inc.,” to offer integrated marketing solutions to your clients. You review Tech Solutions Inc.’s financial statements.
Analysis:
- Income Statement: Tech Solutions Inc. has experienced rapid revenue growth, but its operating expenses have also increased significantly due to high research and development costs.
- Balance Sheet: The company has a strong cash position and minimal debt. However, its retained earnings are low due to consistent reinvestment in research and development.
- Cash Flow Statement: The company has negative cash flow from operations due to high R&D spending but positive cash flow from financing due to successful equity fundraising.
Conclusion:
Tech Solutions Inc. is a high-growth company with a strong technology platform, but its negative cash flow from operations indicates that it is not yet self-sustaining. You decide to proceed with the partnership, but you negotiate terms that protect your agency from potential financial risks.
5.3. Case Study: Apple Inc.
Apple Inc. is a prime example of a company that effectively manages its financial statements to drive growth and profitability.
- Income Statement: Apple consistently generates high revenue and maintains healthy profit margins through premium pricing and efficient cost management.
- Balance Sheet: Apple has a strong balance sheet with substantial cash reserves and low debt. This financial strength allows the company to invest heavily in research and development and strategic acquisitions.
- Cash Flow Statement: Apple consistently generates positive cash flow from operations, which it uses to fund its growth initiatives, return capital to shareholders through dividends and share repurchases, and maintain a strong financial position.
Apple’s ability to effectively manage its financial statements has been a key driver of its success, allowing it to innovate, expand into new markets, and deliver strong returns to its shareholders.
6. Utilizing Financial Statement Analysis Tools
To streamline the analysis of financial statements, several tools and resources are available. These tools can help you quickly assess a company’s financial health and identify potential partnership opportunities.
| Tool/Resource | Description |
|---|---|
| Financial Ratio Calculators | Online calculators that automate the calculation of financial ratios, such as ROA, ROE, and debt-to-equity. |
| Financial Statement Templates | Excel templates that provide a structured framework for analyzing financial statements and calculating key metrics. |
| Financial Analysis Software | Software packages that offer advanced features for analyzing financial statements, such as trend analysis, benchmarking, and forecasting. Examples include: QuickBooks, Xero, NetSuite |
| Online Databases | Databases that provide access to financial statements and key financial data for public companies. Examples include: Bloomberg Terminal, Thomson Reuters Eikon, S&P Capital IQ |
| Professional Advisors | Financial advisors and consultants who can provide expert guidance on analyzing financial statements and evaluating partnership opportunities. |
7. Maximizing Partnership Opportunities Through Financial Acumen
Understanding the connections between the balance sheet, income statement, and cash flow statement is vital for making informed business decisions and identifying lucrative partnership opportunities. By analyzing the financial statements of potential partners, businesses can assess their financial health, stability, and growth potential, and make strategic decisions that drive long-term success.
At income-partners.net, we provide resources and support to help businesses navigate the complexities of financial analysis and identify the best partnership opportunities for their unique needs. Visit our website to explore our services and discover how we can help you build strategic partnerships that boost your income and achieve your business goals.
8. Leveraging AI for Enhanced Financial Statement Analysis
Artificial intelligence (AI) is transforming financial statement analysis, offering powerful tools to improve accuracy and efficiency. AI can automatically validate links between reports and identify hidden discrepancies. Wall Street Prep and Columbia Business School Executive Education have created the AI for Business & Finance Certificate Program to help professionals apply AI to integrated reporting, improving accuracy, speed, and strategic insight.
For businesses seeking to optimize their financial strategies and partnership evaluations, integrating AI tools can provide a competitive edge.
9. Call to Action: Explore Partnership Opportunities with Income-Partners.net
Ready to take your business to the next level? Visit income-partners.net to discover a wide range of partnership opportunities and access expert resources to help you make informed decisions. Whether you’re looking for strategic alliances, distribution partners, or technology collaborators, we have the tools and support you need to succeed.
- Explore Partnership Opportunities: Find potential partners that align with your business goals.
- Access Expert Resources: Learn how to analyze financial statements and evaluate partnership opportunities.
- Build Strategic Alliances: Connect with like-minded businesses and build lasting relationships.
Don’t miss out on the chance to transform your business and achieve financial success. Visit income-partners.net today and start building your future.
10. Frequently Asked Questions (FAQ)
Here are some frequently asked questions about the relationship between the balance sheet, income statement, and cash flow statement:
10.1. What is the primary purpose of the income statement?
The income statement’s primary purpose is to present a company’s financial performance over a specific period, showing revenues, expenses, and net income.
10.2. How does the balance sheet differ from the income statement?
The balance sheet provides a snapshot of a company’s assets, liabilities, and equity at a specific point in time, while the income statement presents a company’s financial performance over a period.
10.3. Why is net income important in the cash flow statement?
Net income is the starting point for the cash flow statement under the indirect method. It is adjusted for non-cash items and changes in working capital to arrive at cash from operations.
10.4. What are some common non-cash expenses added back to net income?
Common non-cash expenses include depreciation, amortization, and stock-based compensation.
10.5. How do capital expenditures (Capex) impact the financial statements?
Capex are recorded as cash outflows in the investing activities section of the cash flow statement and increase the PP&E balance on the balance sheet.
10.6. How do proceeds from debt and equity issuances affect the financial statements?
Proceeds from debt and equity issuances are recorded as cash inflows in the financing activities section of the cash flow statement and increase the debt and equity balances on the balance sheet.
10.7. What is the role of retained earnings in linking the income statement and balance sheet?
Net income from the income statement increases the retained earnings balance on the balance sheet, while dividends paid to shareholders decrease retained earnings.
10.8. How can financial ratios help in analyzing financial statements?
Financial ratios provide insights into a company’s profitability, liquidity, efficiency, and solvency, helping investors and analysts assess its financial health and performance.
10.9. What is trend analysis and why is it important?
Trend analysis involves analyzing the trends in a company’s financial performance over time. It helps identify consistent improvements or declines in revenue, profitability, and cash flow.
10.10. Where can I find reliable financial data for public companies?
Reliable sources for financial data include online databases like Bloomberg Terminal, Thomson Reuters Eikon, and S&P Capital IQ, as well as company websites and regulatory filings.
By understanding these FAQs, you can enhance your comprehension of financial statements and improve your ability to make informed business and investment decisions. Contact income-partners.net at Address: 1 University Station, Austin, TX 78712, United States. Phone: +1 (512) 471-3434 for more personalized assistance.