In the competitive world of hedge funds, emerging managers often seek the backing and mentorship of industry titans. For Jonathan Auerbach, that pivotal moment came in 2004 when he secured a deal with Tiger Management and a personal investment from Julian Robertson himself. This marked the birth of Hound Partners, a name chosen in collaboration with his then-partner Scott McLellan, who later launched Marble Arch Investments in 2007. Since its inception, Hound Partners has not only survived but thrived, firmly establishing itself as a significant player in the hedge fund landscape.
Today, Hound Partners stands as the second-largest Tiger Seed fund, a testament to Auerbach’s investment acumen and strategic leadership. With approximately $5 billion in publicly disclosed market value, the fund’s growth and performance warrant a closer examination. Adding another dimension to their strategy, Auerbach expanded Hound Partners with a long-only fund launch early last year, mirroring a trend seen among his Tiger brethren. This analysis will particularly resonate with investors interested in this long-only approach, as we delve into the skills and portfolio characteristics evident in Hound Partners‘ long book.
As part of our ongoing “Manager Mondays” series, this deep dive into Hound Partners relies exclusively on publicly available data. This includes manager profiles, simulated performance metrics, and comprehensive analyses, all derived from public filings. It’s important to note that this analysis excludes short positions, non-equity securities, many non-US securities, and any non-public information, including actual fund performance figures.
Bearing these parameters in mind, we present an unprecedentedly detailed and rigorous examination of Hound Partners, a highly successful manager whose inner workings deserve closer scrutiny.
Hound Partners’ Performance Analysis
Let’s begin by dissecting the simulated performance of Hound Partners‘ long equity portfolio.
 Performance chart of Hound Partners' long book
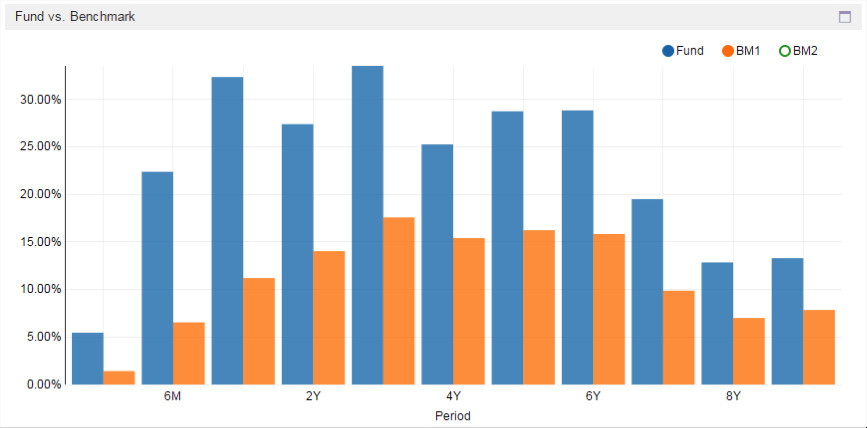
The data reveals a compelling narrative of significant outperformance relative to broader market indices. Hound Partners has consistently exceeded market returns, with the most substantial outperformance concentrated post-2011. Remarkably, since 2011, the fund’s long book has generated a return of 182%, dwarfing the S&P 500’s 80% gain over the same period. This robust performance trajectory provides a strong rationale for the timing of their long-only fund launch in January 2014. Since then, the long book has continued its winning streak, delivering a 46% return compared to the market’s 22%.
Analyzing performance on a rolling 12-month basis further underscores the consistency of Hound Partners‘ strategy. The manager demonstrates a pattern of moderate yet persistent outperformance over extended multi-year horizons. This is a hallmark of fundamental long/short equity strategies that prioritize sustained gains over short-term, explosive returns, distinguishing it from, for example, activist strategies known for rapid but potentially volatile gains.
Asset Growth at Hound Partners
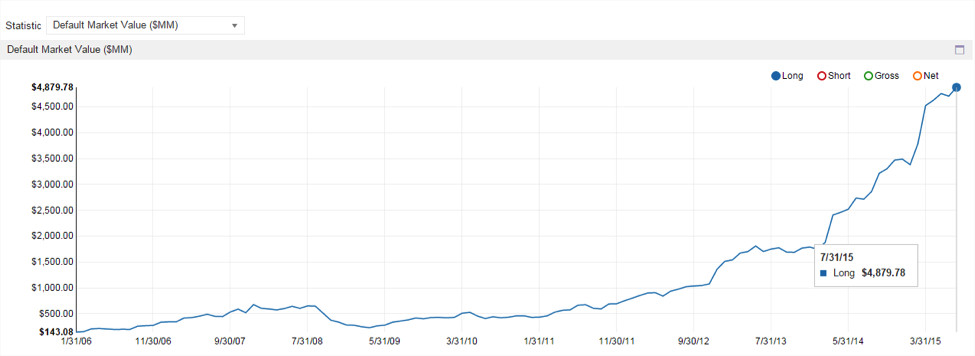
Strong performance often acts as a catalyst for asset growth, and Hound Partners exemplifies this dynamic. The fund’s reported market value has surged dramatically from $432 million in January 2011 to nearly $5 billion today.
 Asset growth chart of Hound Partners from 2011 to present
This substantial asset growth naturally prompts questions about its impact on portfolio management. Previous research has indicated that managers typically employ three primary levers to manage increasing assets under management (AUM). These include: increasing average market capitalization within the portfolio, expanding the number of positions held, or experiencing a reduction in portfolio liquidity. Often, it’s a combination of these factors.
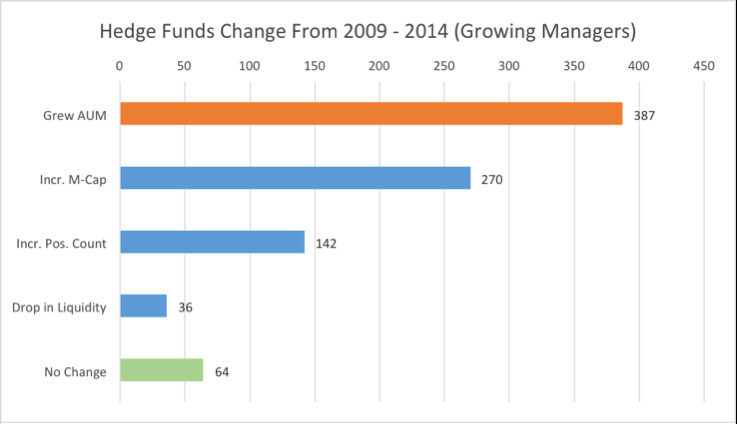 Chart illustrating levers managers use to deal with asset growth
Let’s examine how asset growth has influenced Hound Partners‘ portfolio, starting with position count and concentration. One might assume that to deploy new capital, Hound Partners would diversify by adding numerous new positions, thereby diluting portfolio concentration. However, data suggests the opposite. Post-financial crisis, the number of positions actually decreased significantly and has remained relatively low.
Furthermore, portfolio concentration, already notably high, has increased since 2013:
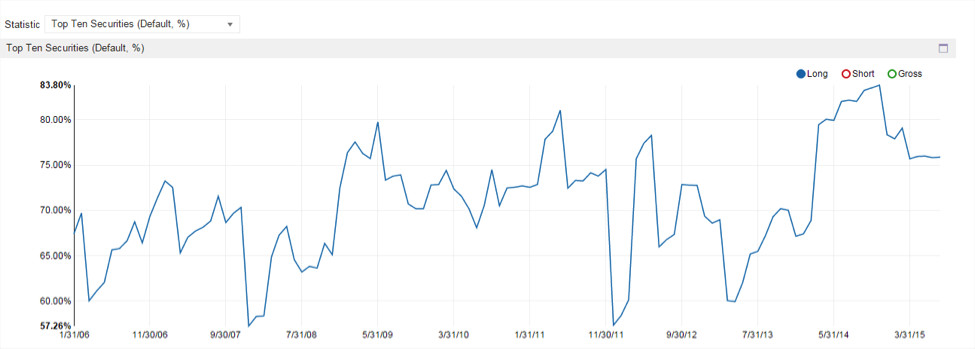 Chart showing position count and concentration for Hound Partners
Interestingly, this increased concentration has not translated into higher volatility, particularly in the prolonged bull market environment. In fact, portfolio volatility has diminished. This suggests that Hound Partners effectively avoids “diworsification,” the phenomenon where excessive diversification can dilute returns. They maintain a concentrated portfolio with enough positions to manage risk and downside volatility without sacrificing returns.
Another hypothesis is that new capital was channeled into existing holdings, potentially straining portfolio liquidity. While partially true, liquidity has only slightly decreased recently and remains at a healthy level. Assuming Hound Partners aims to sell no more than 20% of the 90-day average trading volume of their holdings, they could liquidate 71% of their portfolio in 30 trading days. While this is robust and better than average, it’s a decrease from the 96% liquidity they enjoyed in January 2011, their peak liquidity and a top-quartile figure among all managers.
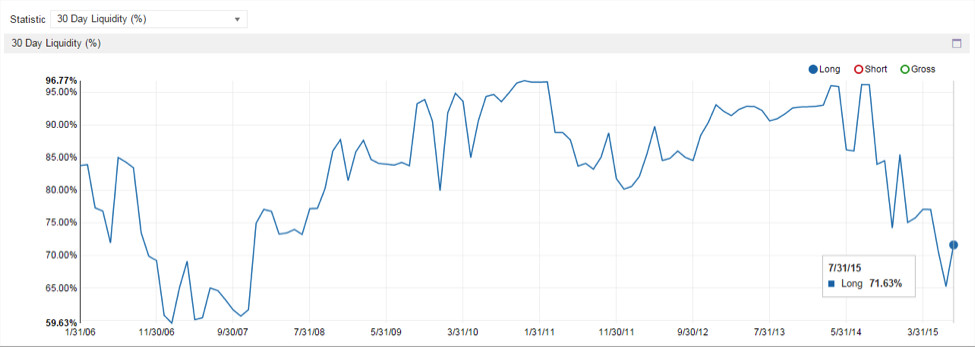 Liquidity analysis chart for Hound Partners portfolio
The remaining lever is the shift towards larger market capitalization stocks. Let’s investigate this final assumption. The following chart illustrates the median market capitalization of Hound Partners‘ portfolio holdings.
Bingo. Hound Partners‘ primary response to asset growth aligns with the industry norm: a move up the market capitalization spectrum. The median market cap of their holdings has risen from $2.6 billion in 2011 to $11 billion currently. This increase is partly due to the organic appreciation of their existing holdings and partly a deliberate strategic shift towards larger capitalization securities:
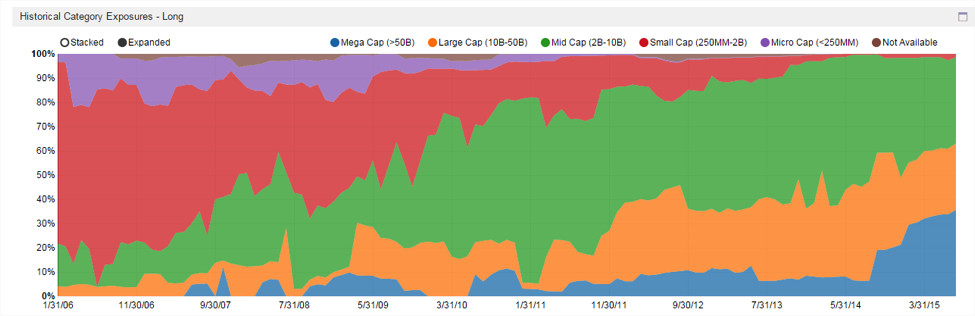 Chart showing median market cap evolution of Hound Partners' portfolio
Market Capitalization Focus at Hound Partners
It’s a valid question for investors to ask whether this style drift towards larger caps represents a beneficial evolution or a cause for concern. Data suggests that mid-cap stocks are actually a “sweet spot” for Hound Partners, showing the most significant growth in allocation. Large and mega-cap stocks also contribute solid returns and alpha. Critically, Hound Partners doesn’t appear to be losing performance by reducing exposure to small and micro-cap names. This is evident in the following charts, which break down Return on Invested Capital (ROIC), Contribution, Batting Average, Win/Loss ratio, and Security Selection skill across different market cap buckets.
Batting Average – indicating the frequency of successful stock picks (13 out of 13 mega-cap positions have been profitable):
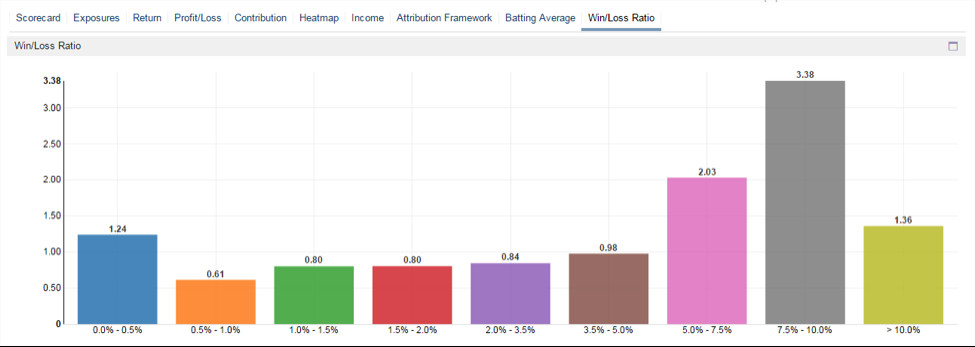
Win/Loss Ratio – measuring the magnitude of gains versus losses (undefined for mega-caps due to no losing positions):
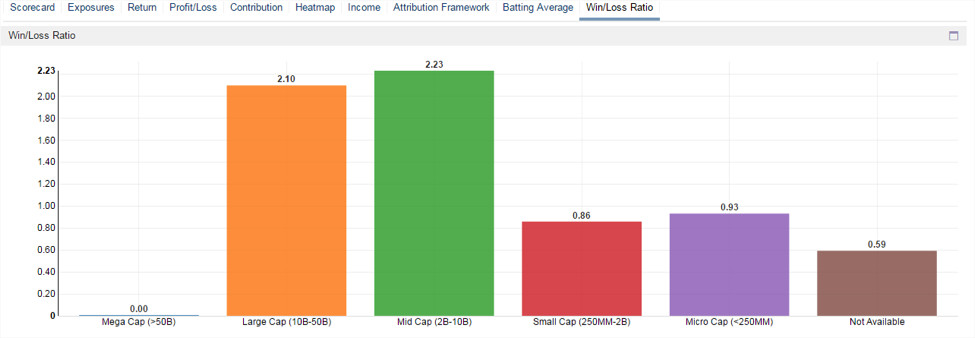 Win/Loss ratio and Batting Average charts by market cap
Average ROIC for securities within each market capitalization bucket:
Cumulative contribution to portfolio performance from each market capitalization bucket:
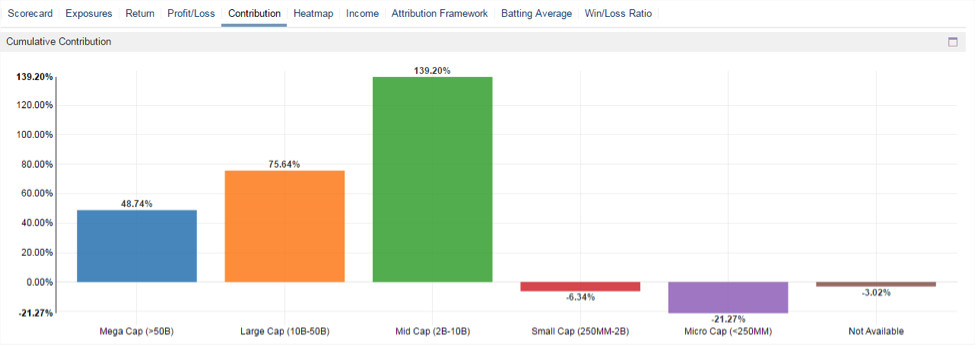 ROIC and Cumulative Contribution charts by market cap
Security Selection skill is notably high in mid, large, and mega-cap segments:
These charts collectively demonstrate that the shift in market cap focus has, if anything, benefited Hound Partners and its investors.
Sector Allocation Strategy at Hound Partners
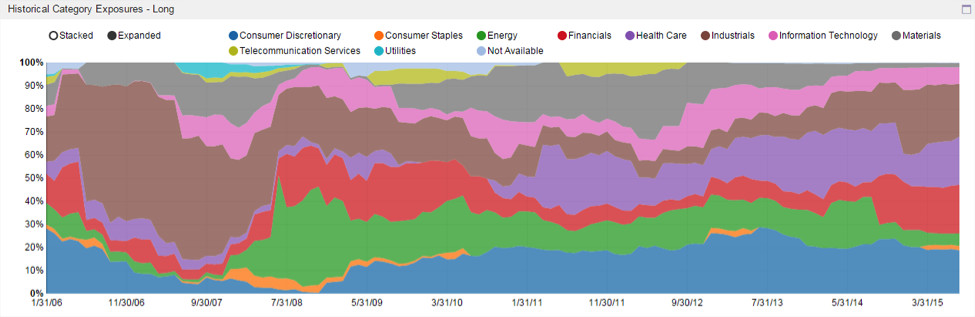
Analyzing sector exposures reveals that Industrials, Healthcare, Financials, and Consumer Discretionary sectors constitute approximately 80% of Hound Partners‘ long portfolio.
 Sector exposure chart for Hound Partners' long portfolio
While Hound Partners has increased concentration in its top four sectors in recent years, the portfolio maintains a generally diversified profile. Examining a scorecard of sector performance since 2006 highlights significant skill in their largest sector allocations. The Win/Loss ratio in each of these sectors is above average (2.3x+), with Financials exhibiting particularly strong performance (top quartile).
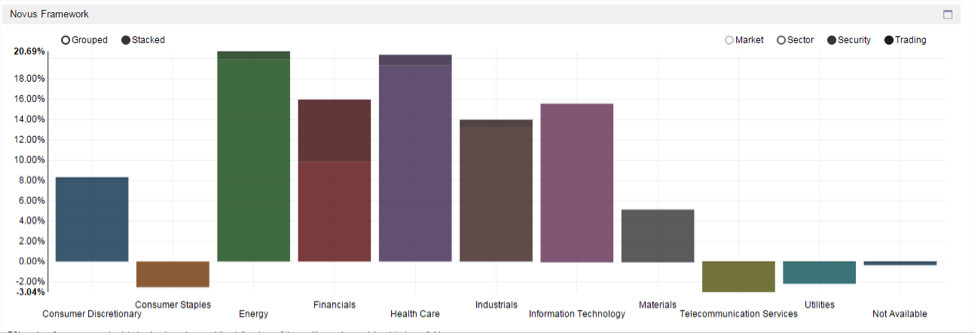
The chart below quantifies the value generated by Hound Partners‘ stock selection within sectors, isolating it from broader market and sector volatility effects. Again, sectors with high exposure – Healthcare, Financials, and Industrials – also demonstrate strong stock-picking skill. This suggests a deliberate and effective strategy of allocating capital to sectors where Hound Partners possesses a demonstrable edge. Interestingly, strong skill is also observed in Energy and IT, sectors that have historically been underweight in their portfolio.
 Sector scorecard showing stock picking skill by sector
Position Sizing Expertise at Hound Partners
Position sizing is a critical skill highly valued by investors. As frequently highlighted, effective position sizing – the ability to amplify winning positions – is a hallmark of successful managers, particularly within the Tiger Cub lineage. Hound Partners exemplifies this trait. Comparing their portfolio performance to a hypothetical equally-weighted portfolio of the same stocks, rebalanced monthly, reveals the impact of their position sizing skill.
Stock selection alone does not account for Hound Partners‘ exceptional returns. An equally-weighted portfolio of the same holdings would have underperformed Hound Partners by a substantial 115 percentage points since 2006. A key factor is Hound Partners‘ sweet spot for position size, ranging from 7.5% to 10% of the portfolio. Within this size bucket, they generate an average profit of $3.40 on winning positions for every dollar lost on detractors.
 Position sizing analysis chart for Hound Partners
A similar pattern emerges when analyzing performance based purely on ROIC. This reinforces the conclusion that skillful position sizing is a significant driver of Hound Partners‘ success.
Portfolio Positions at Hound Partners
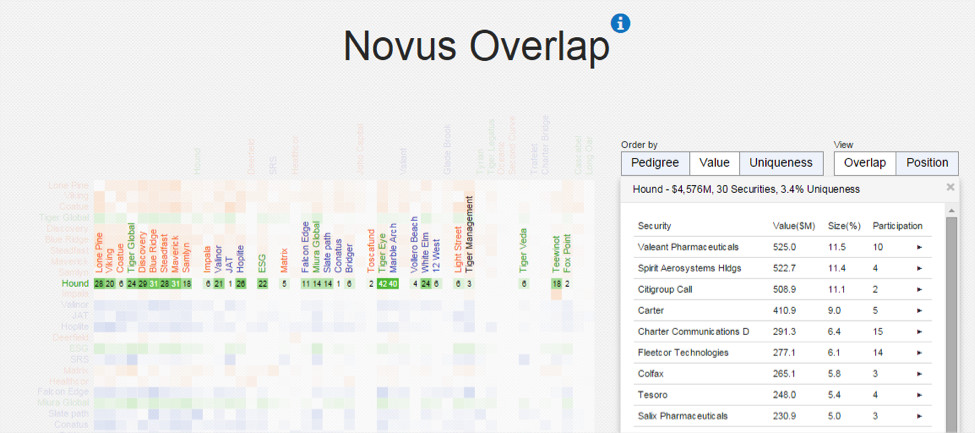
Shifting focus to specific positions held by Hound Partners provides further insights into their investment process. Analyzing holdings disclosed as of March 31st reveals commonalities with their Tiger Cub peers. Their top holding, Valeant, is shared by nine other Tiger Cubs and is a popular choice among hedge funds, including activist investors. Other significant positions like Charter Communications and Fleetcor are also high-consensus names within the Tiger Cub network. In fact, only a small fraction (3.4%) of Hound Partners‘ portfolio value is invested in companies not held by at least one other Tiger Cub.
 Overlap analysis of Hound Partners' portfolio with Tiger Cubs
High overlap with Tiger Cub consensus positions is not necessarily detrimental. These consensus picks often represent high-conviction, well-researched investments that tend to outperform. Conversely, unique, non-consensus positions are more likely to negatively impact performance across Tiger Cub portfolios, as detailed in prior research.
Over the past decade, Hound Partners has invested in 253 unique securities, with approximately 54% contributing positively to portfolio P&L (on average) and 67% of capital allocated to winning positions (on average). Hound Partners‘ strength lies in its win/loss ratio – consistently generating greater gains from winning positions than losses from detractors.
Below are the top contributors to Hound Partners‘ P&L over the last decade. Notably, eight positions have each contributed over 1,000 basis points to total P&L, indicating healthy diversification of return drivers. These top winners span diverse sectors, further highlighting Hound Partners‘ generalist approach.
Conversely, only one detractor, Petrohawk Energy, has cost over 1,000 basis points. This position was exited in Q1 2011, and since then, Hound Partners has effectively managed downside risk from individual positions.
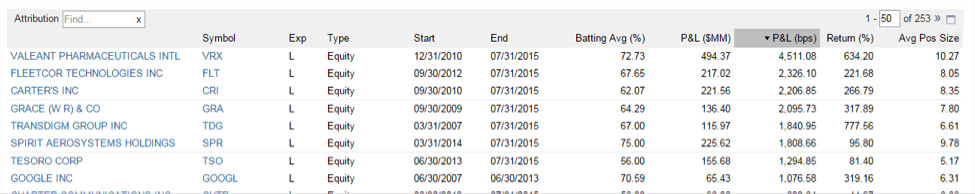 Top and bottom contributors to Hound Partners' P&L over the last decade
Recent Portfolio Activity: Largest Positions and Q2 Trades
Analyzing the latest 13F filings reveals Hound Partners‘ most current public positions and significant trades. Of particular note is the initiation of a boxed position (long equity plus a put option) in King Digital, the developer of Candy Crush Saga, and exits from Salix Pharmaceuticals, Sensata Tech, and Frontier Communications.
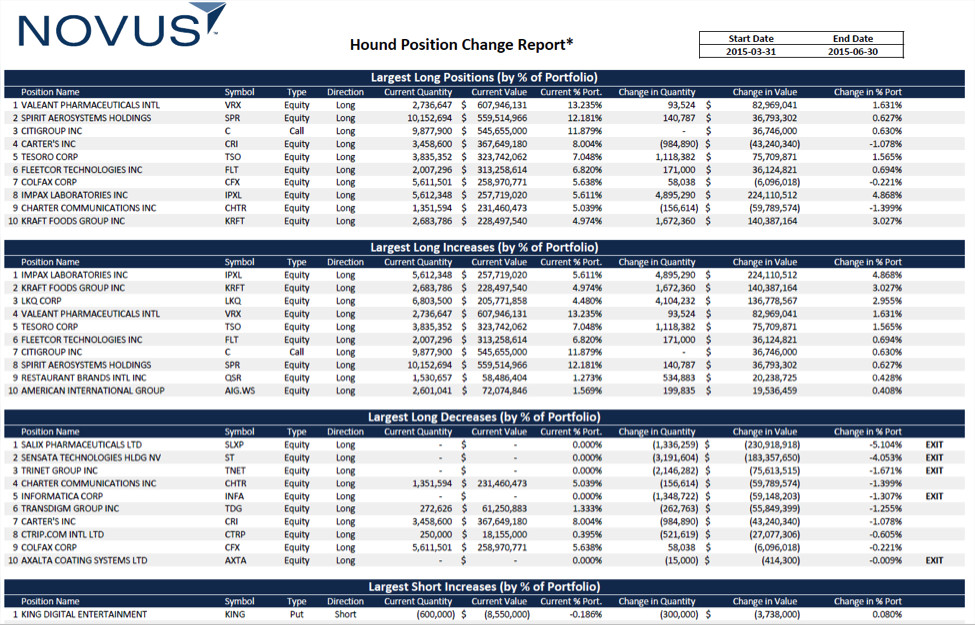 Chart of Hound Partners' largest positions and Q2 trades
Conclusion
This comprehensive analysis reveals that Hound Partners has successfully leveraged its core strengths and adapted its investment process to optimize performance. Their proficiency in position sizing, stock selection, and strategic sector allocation has been particularly beneficial, especially in recent years. Hound Partners stands as a compelling case study of a Tiger Seed fund that has not only grown significantly but also refined its investment edge over time.
Learn More
This analysis demonstrates the depth of insights obtainable from public data analysis. To explore the power of private data analytics and discover how leading investors utilize the Novus platform to enhance their performance, we encourage you to delve deeper. The Novus platform empowers investors of all sizes to maximize their performance potential. Visit us to learn more and schedule a demo.
For further inquiries, contact the author at [email protected] or via Twitter @saltshuller.