Calculating the Cost of Goods Sold (COGS) from the income statement is essential for understanding profitability and identifying opportunities for revenue growth through strategic partnerships, and income-partners.net can help you find the right partners. Determining your COGS accurately and finding reliable partners for collaboration can significantly improve your financial performance, allowing you to enhance operational efficiency and expand market reach.
1. What is the Cost of Goods Sold (COGS)?
The Cost of Goods Sold (COGS), also referred to as the “cost of sales,” represents the direct expenses a company incurs in producing and selling its goods or services. This figure is a critical component of the income statement, directly impacting a company’s gross profit and overall profitability. Understanding and managing COGS is essential for businesses aiming to optimize their financial performance.
COGS includes costs such as:
- Purchase of Inventory/Merchandise: The cost of buying products for resale.
- Cost of Raw Materials: The cost of materials used in producing goods.
- Cost of Direct Labor: Wages and benefits for workers directly involved in production.
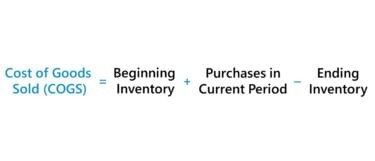 Cost of Goods Sold (COGS)
Cost of Goods Sold (COGS) Formula example shows how direct costs affect profitability and strategic decision-making in business.
2. What is the Formula to Calculate Cost of Goods Sold (COGS)?
The Cost of Goods Sold (COGS) formula calculates the direct costs associated with producing goods sold during a specific period. This formula helps businesses understand the true cost of their products and assess profitability. Accurate COGS calculation is crucial for financial reporting and strategic decision-making.
The standard COGS formula is:
COGS = Beginning Inventory + Purchases During the Period – Ending Inventory
Here’s a breakdown of each component:
- Beginning Inventory: This is the value of inventory a company has at the start of an accounting period. It includes all products ready to be sold.
- Purchases During the Period: This refers to the cost of all additional inventory purchased during the same accounting period. It includes raw materials, components, and merchandise bought for resale.
- Ending Inventory: This is the value of inventory that remains unsold at the end of the accounting period. It represents the goods still in stock and available for sale in the next period.
Example:
Suppose a company starts the year with $50,000 in inventory, purchases an additional $30,000 in inventory during the year, and ends the year with $40,000 in unsold inventory. The COGS would be calculated as follows:
COGS = $50,000 (Beginning Inventory) + $30,000 (Purchases) – $40,000 (Ending Inventory) = $40,000
This calculation provides a clear picture of the direct costs tied to the goods a company sold, offering insights into pricing strategies, profitability, and overall financial health.
3. What Are Examples of Cost of Goods Sold (COGS) Items?
COGS typically includes:
- Direct labor costs for workers involved in production.
- Costs of raw materials used to manufacture products.
- Purchase price of inventory or merchandise for resale.
- Freight or shipping costs to acquire inventory.
- Factory overhead expenses, such as utilities and rent.
- Depreciation of production equipment.
4. How Do I Differentiate COGS from Operating Expenses?
The distinction between Cost of Goods Sold (COGS) and Operating Expenses (OpEx) is crucial for understanding a company’s financial structure and profitability. COGS represents the direct costs tied to producing goods or services, while OpEx encompasses the costs required to keep the business running daily. This difference is fundamental in assessing a company’s operational efficiency and financial health.
4.1. Direct Costs (COGS)
COGS, or direct costs, include expenses directly associated with producing or acquiring the goods or services that a company sells. These costs are typically variable, changing with the volume of production. Key components of COGS include:
- Raw Materials: The cost of materials used to create the final product.
- Direct Labor: Wages and benefits for workers directly involved in manufacturing or service delivery.
- Purchase Price of Inventory: The cost of buying merchandise for resale.
- Freight Costs: Expenses for shipping to acquire inventory.
4.2. Indirect Costs (OpEx)
Operating Expenses, or indirect costs, cover the expenses a company incurs to support its operations, regardless of production volume. These are often fixed costs that remain relatively stable. Examples of OpEx include:
- Rent and Utilities: Costs for facilities and related services.
- Marketing and Advertising: Expenses for promoting products or services.
- Salaries of Administrative Staff: Wages for employees not directly involved in production.
- Research and Development: Costs for developing new products or improving existing ones.
4.3. Key Differences
| Feature | Cost of Goods Sold (COGS) | Operating Expenses (OpEx) |
|---|---|---|
| Nature of Costs | Direct costs tied to production | Indirect costs to support business operations |
| Variability | Typically variable, changes with production volume | Often fixed, remains stable regardless of production volume |
| Included Expenses | Raw materials, direct labor, purchase price of inventory, freight costs | Rent, utilities, marketing, administrative salaries, research and development |
| Impact on Profit | Directly affects gross profit (Revenue – COGS) | Affects operating profit (Gross Profit – OpEx) |
| Examples | Manufacturing company: raw materials; Retail store: cost of merchandise | Software company: marketing; Consulting firm: administrative salaries |
| Accounting Method | Recognized when goods are sold (matching principle) | Recognized when incurred (period costs) |
| Tax Implications | Reduces taxable income by lowering gross profit | Reduces taxable income by lowering operating profit |
| Financial Analysis | Used to calculate gross margin, reflecting production efficiency | Used to calculate operating margin, reflecting overall operational efficiency |
| Management Focus | Controlling and reducing production costs | Managing and optimizing administrative and marketing costs |
| Industry Impact | Significant in manufacturing, retail, and wholesale | Significant in service-based industries, technology, and administration |
| Forecasting | Often forecasted based on sales volume and production costs | Often forecasted based on historical trends and business strategies |
| Capitalization | Not capitalized (expensed directly) | May be capitalized (e.g., research and development in certain cases) |
| Financial Reporting | Reported separately on the income statement | Reported separately on the income statement |
4.4. Impact on Financial Statements
- Income Statement: COGS is subtracted from revenue to calculate gross profit, while OpEx is subtracted from gross profit to calculate operating profit.
- Gross Profit: Indicates how efficiently a company manages its production costs.
- Operating Profit: Reflects how well a company manages its overall business operations.
4.5. Industry-Specific Differences
- Manufacturing: COGS includes raw materials, direct labor, and factory overhead.
- Retail: COGS primarily includes the purchase price of merchandise.
- Service: COGS may include direct labor and costs of materials used in providing the service.
- Technology: COGS for a software company might include hosting fees and third-party APIs.
4.6. Strategic Implications
Understanding the difference between COGS and OpEx is crucial for making informed business decisions:
- Cost Control: Identifying which costs fall into COGS and OpEx helps companies target areas for cost reduction.
- Pricing Strategies: Accurate COGS calculation is essential for setting prices that ensure profitability.
- Operational Efficiency: Monitoring OpEx helps in optimizing administrative and marketing expenses.
5. How Does COGS Affect Gross Profit?
Gross profit indicates the earnings remaining after deducting direct costs (COGS) from revenue, showcasing a company’s efficiency in managing production costs. A higher gross profit margin suggests greater profitability and better cost control.
The formula is:
Gross Profit = Revenue – Cost of Goods Sold (COGS)
Additionally, dividing a company’s gross profit by its revenue yields the gross profit margin, a widely used metric for assessing profitability.
Gross Margin (%) = (Revenue – COGS) ÷ Revenue
6. How Can I Analyze COGS Margin?
The Cost of Goods Sold (COGS) margin offers valuable insights into a company’s cost structure and operational efficiency. It is calculated by dividing the Cost of Goods Sold by the total revenue, providing a percentage that indicates the proportion of revenue used to cover direct production costs. Analyzing this margin helps businesses understand their profitability and make informed decisions about pricing and cost management.
The formula for COGS margin is:
COGS Margin (%) = Cost of Goods Sold (COGS) ÷ Revenue
6.1. Understanding COGS Margin
The COGS margin represents the percentage of revenue a company spends on producing or acquiring the goods it sells. A lower COGS margin indicates higher profitability, as a smaller portion of revenue is used to cover direct costs. Conversely, a higher COGS margin suggests lower profitability, as a larger portion of revenue is consumed by production costs.
6.2. Factors Influencing COGS Margin
Several factors can influence a company’s COGS margin, including:
- Raw Material Costs: Fluctuations in the prices of raw materials can significantly impact COGS.
- Labor Costs: Changes in wages and benefits for production workers can affect COGS.
- Production Efficiency: Improvements in production processes can lower COGS by reducing waste and increasing output.
- Supplier Relationships: Strong relationships with suppliers can lead to better pricing and lower costs.
- Inventory Management: Effective inventory management can reduce storage costs and minimize losses from obsolescence.
6.3. Benchmarking COGS Margin
Benchmarking the COGS margin against industry averages and competitors can provide valuable insights into a company’s performance. If a company’s COGS margin is higher than the industry average, it may indicate inefficiencies in production or higher input costs. Conversely, a lower COGS margin may suggest a competitive advantage in cost management or superior production processes.
6.4. Strategies to Improve COGS Margin
Improving the COGS margin involves implementing strategies to reduce direct production costs and increase efficiency. Here are some effective approaches:
- Negotiate with Suppliers: Negotiating better pricing with suppliers can lower the cost of raw materials and inventory.
- Optimize Production Processes: Streamlining production processes can reduce waste, increase output, and lower labor costs.
- Invest in Technology: Implementing new technologies can automate tasks, improve efficiency, and reduce errors.
- Manage Inventory Effectively: Implementing inventory management systems can reduce storage costs and minimize losses from obsolescence.
- Train Employees: Investing in employee training can improve skills, increase productivity, and reduce errors.
6.5. Analyzing Trends in COGS Margin
Monitoring the COGS margin over time can reveal important trends and insights into a company’s performance. A declining COGS margin may indicate improving efficiency and profitability, while an increasing COGS margin may signal rising costs or operational challenges. Analyzing these trends helps businesses identify areas for improvement and make proactive decisions.
6.6. Example of COGS Margin Analysis
Consider two companies in the retail industry: Company A and Company B.
- Company A: Revenue = $1,000,000, COGS = $600,000
- Company B: Revenue = $1,000,000, COGS = $400,000
Calculating the COGS margin for each company:
- Company A: COGS Margin = ($600,000 ÷ $1,000,000) x 100% = 60%
- Company B: COGS Margin = ($400,000 ÷ $1,000,000) x 100% = 40%
In this example, Company B has a lower COGS margin (40%) compared to Company A (60%), indicating that Company B is more efficient in managing its direct production costs. This analysis suggests that Company B is more profitable and has a competitive advantage in cost management.
6.7. Using COGS Margin in Financial Planning
The COGS margin is a valuable tool for financial planning and forecasting. By understanding the relationship between revenue and direct production costs, businesses can make informed decisions about pricing, cost control, and investment strategies. Monitoring the COGS margin and implementing strategies to improve it can lead to increased profitability and long-term financial success.
7. Cost of Goods Sold (COGS) Calculation Example
Let’s illustrate with an example:
A clothing retail store starts Year 1 with $25 million in beginning inventory. Throughout Year 1, the retailer purchases an additional $10 million in inventory but fails to sell $5 million in inventory.
Therefore, the COGS for Year 1 is calculated as follows:
COGS = $25m + $10m – $5m = $30m
This $30 million COGS figure is then used to calculate the gross profit, showing it as a cash outflow.
The gross profit for Year 1 is $50 million ($80m – $30m), resulting in a gross margin of 62.5%.
Gross Profit = $80m – $30m = $50m
Gross Margin (%) = $50m ÷ $80m = 62.5%
The COGS margin can be derived by subtracting the gross margin from 1:
COGS Margin (%) = 1 – 62.5% = 37.5%
 COGS Calculator
COGS Calculator image demonstrates how Excel models help in assessing gross profit and margin, aiding financial forecasting.
8. How to Forecast Cost of Goods Sold (COGS)?
One common forecasting approach assumes a gross margin based on historical and industry averages since public companies aren’t required to disclose internal inventory data.
For instance, if we assume a gross margin of 80.0% and revenue is $100 million, the gross profit would be $80 million.
To find COGS, subtract revenue from gross profit:
COGS = $100 million (Revenue) – $80 million (Gross Profit) = $20 million
9. What are the Search Intentions for “How to Calculate COGS From Income Statement?”
Understanding user search intentions is critical to creating content that meets their needs. For the keyword “How To Calculate Cogs From Income Statement,” the primary search intentions include:
- Informational: Users seek to understand what COGS is, its components, and its significance in financial statements.
- Educational: Users want detailed steps and examples to calculate COGS accurately from an income statement.
- Comparative: Users aim to differentiate COGS from other financial metrics like operating expenses.
- Analytical: Users intend to analyze the impact of COGS on a company’s profitability and financial health.
- Practical Application: Users need tools, templates, or real-world scenarios to apply COGS calculations effectively.
10. What are the Benefits of Strategic Partnerships in Managing COGS?
Strategic partnerships can offer numerous advantages in managing and optimizing the Cost of Goods Sold (COGS). By collaborating with the right partners, businesses can improve efficiency, reduce costs, and enhance their competitive position. These partnerships can take various forms, including supplier alliances, joint ventures, and collaborative agreements.
10.1. Cost Reduction Through Supplier Alliances
Supplier alliances involve forming close, collaborative relationships with key suppliers to achieve mutual benefits. These alliances can lead to cost reductions in several ways:
- Volume Discounts: By consolidating purchasing volume with a preferred supplier, businesses can negotiate better pricing and discounts on raw materials and components.
- Improved Payment Terms: Strong supplier relationships can result in more favorable payment terms, such as extended payment periods, which can improve cash flow management.
- Joint Cost Reduction Initiatives: Collaborating with suppliers on cost reduction initiatives, such as process improvements and value engineering, can lead to significant savings.
10.2. Enhanced Efficiency Through Joint Ventures
Joint ventures involve two or more companies pooling their resources and expertise to achieve a common objective. These ventures can enhance efficiency in several ways:
- Shared Resources: By sharing resources such as manufacturing facilities, distribution networks, and technology, businesses can reduce duplication and lower overhead costs.
- Economies of Scale: Joint ventures can achieve economies of scale by combining production volumes and streamlining operations, resulting in lower per-unit costs.
- Access to New Markets: Partnering with companies that have established market presence can accelerate market entry and reduce marketing and distribution expenses.
10.3. Innovation Through Collaborative Agreements
Collaborative agreements involve businesses working together on specific projects or initiatives to achieve mutual goals. These agreements can foster innovation and lead to cost savings in several ways:
- Knowledge Sharing: By sharing knowledge and expertise, businesses can develop new products, processes, and technologies that improve efficiency and reduce costs.
- Joint Research and Development: Collaborating on research and development efforts can lower the cost of innovation and accelerate the development of new solutions.
- Risk Sharing: Collaborative agreements allow businesses to share the risks associated with new ventures, reducing the financial burden on any single entity.
10.4. Real-World Examples of Successful Partnerships
Several companies have successfully leveraged strategic partnerships to manage and optimize their COGS:
- Starbucks and Spotify: Starbucks partnered with Spotify to enhance the in-store customer experience and drive loyalty. The partnership allowed Starbucks to offer its employees and customers access to Spotify’s music streaming service, creating a more engaging and personalized experience.
- Apple and Accenture: Apple partnered with Accenture to provide business solutions for iOS. The partnership combined Apple’s hardware and software expertise with Accenture’s consulting and technology capabilities to help businesses transform their operations and improve customer engagement.
- BMW and Toyota: BMW and Toyota partnered to develop new technologies for electric vehicles and fuel cell systems. The collaboration allowed both companies to share research and development costs, accelerate innovation, and reduce the time to market for new products.
- Walmart and P&G: Walmart and Procter & Gamble (P&G) have a long-standing partnership focused on supply chain optimization. By sharing data and collaborating on inventory management, they have reduced costs and improved efficiency, resulting in lower prices for consumers.
10.5. Maximizing Benefits from Strategic Partnerships
To maximize the benefits of strategic partnerships in managing COGS, businesses should:
- Identify the Right Partners: Choose partners that align with their strategic goals and have complementary capabilities.
- Establish Clear Objectives: Define clear objectives and metrics for the partnership to ensure that it delivers tangible results.
- Build Trust and Communication: Foster open communication and trust between partners to facilitate collaboration and knowledge sharing.
- Share Risks and Rewards: Structure the partnership in a way that shares both the risks and rewards equitably among partners.
- Monitor and Evaluate Performance: Regularly monitor and evaluate the performance of the partnership to ensure that it is meeting its objectives and delivering value.
FAQ: Calculating COGS from the Income Statement
Here are some frequently asked questions about calculating the Cost of Goods Sold (COGS) from the income statement:
1. Why is it important to calculate COGS accurately?
Accurate COGS calculation is crucial for determining a company’s gross profit, which directly impacts its profitability and financial health. It helps in making informed decisions about pricing, cost control, and inventory management.
2. What components are included in the Cost of Goods Sold (COGS)?
COGS typically includes the cost of raw materials, direct labor costs, purchase price of inventory, freight or shipping costs, factory overhead expenses, and depreciation of production equipment.
3. How does beginning inventory affect the COGS calculation?
Beginning inventory is the value of inventory a company has at the start of an accounting period. It is added to the purchases made during the period and then reduced by the ending inventory to calculate COGS.
4. What is the difference between COGS and operating expenses (OpEx)?
COGS includes direct costs tied to producing goods or services, while operating expenses (OpEx) cover the costs required to keep the business running daily, such as rent, utilities, and marketing expenses.
5. How does COGS affect a company’s gross profit margin?
COGS is subtracted from revenue to calculate gross profit. The gross profit margin is then calculated by dividing the gross profit by revenue. A lower COGS results in a higher gross profit margin, indicating better profitability.
6. Can COGS be negative?
No, COGS cannot be negative. It represents the cost of goods sold, and this value cannot be less than zero.
7. How do changes in inventory valuation methods (FIFO, LIFO) impact COGS?
Inventory valuation methods like FIFO (First-In, First-Out) and LIFO (Last-In, First-Out) can significantly impact COGS. FIFO assumes that the first units purchased are the first ones sold, while LIFO assumes the opposite. These methods can affect the reported value of inventory and, consequently, the COGS.
8. How can a company improve its COGS margin?
A company can improve its COGS margin by negotiating better pricing with suppliers, optimizing production processes, investing in technology, managing inventory effectively, and training employees to improve efficiency and reduce errors.
9. What is the role of technology in calculating and managing COGS?
Technology plays a crucial role in calculating and managing COGS by automating data collection, improving accuracy, and providing real-time insights into inventory levels and production costs. Enterprise Resource Planning (ERP) systems and inventory management software can help streamline these processes.
10. How do strategic partnerships help in managing COGS?
Strategic partnerships can offer numerous advantages in managing and optimizing COGS. By collaborating with the right partners, businesses can improve efficiency, reduce costs through volume discounts and joint cost reduction initiatives, and enhance their competitive position.
Navigating the financial landscape can be complex, but you don’t have to do it alone. At income-partners.net, we provide the resources and connections you need to optimize your financial strategies and foster valuable partnerships.
Ready to take your business to the next level?
Explore the opportunities that await you. Visit income-partners.net today to discover how strategic partnerships can drive your business growth and improve your financial performance. Don’t wait—unlock your potential now and connect with partners who share your vision for success!
Address: 1 University Station, Austin, TX 78712, United States.
Phone: +1 (512) 471-3434.
Website: income-partners.net.