How To Find Gross Profit In Income Statement? Gross profit, a vital financial metric, is easily located on a company’s income statement and reveals profitability before operating expenses. At income-partners.net, we understand how critical it is to maximize your revenue streams through strategic partnerships and financial understanding. By mastering the concept of gross profit, you’re better positioned to enhance your business strategies, identify potential partners, and achieve significant revenue growth. Dive into the details of the income statement and discover the formula for calculating this key indicator, which is essential for financial analysis and making informed business decisions, ultimately improving your earnings potential and fostering lucrative collaborations.
1. Understanding Gross Profit: A Key to Unlocking Business Potential
Gross profit is the revenue a company retains after subtracting the cost of goods sold (COGS). This crucial metric, found on the income statement, provides a clear view of a company’s profitability from its core operations before other expenses are considered. It’s a fundamental figure for assessing financial health and making strategic decisions to enhance revenue.
1.1 The Significance of Gross Profit
Gross profit is more than just a number; it’s a critical indicator of a company’s financial health and operational efficiency. A higher gross profit suggests that a company is efficient in managing its production costs and pricing its products or services effectively. This metric serves as a foundation for various financial analyses, helping businesses understand their profitability, make informed decisions, and attract potential partners. Understanding the gross profit allows you to optimize your business model and explore collaborative opportunities.
1.2 Components of Gross Profit
To fully grasp the significance of gross profit, it’s essential to understand its components:
- Revenue: The total income generated from the sale of goods or services.
- Cost of Goods Sold (COGS): The direct costs associated with producing those goods or services, including materials, labor, and direct overhead.
Gross profit is calculated by subtracting COGS from revenue. This figure represents the income available to cover operating expenses, interest, and taxes, ultimately determining the company’s net income. A higher gross profit margin indicates greater efficiency in production and pricing strategies.
1.3 Why Gross Profit Matters to Partners
For potential partners, gross profit serves as a key indicator of a company’s financial stability and operational efficiency. A healthy gross profit margin suggests that the company manages its production costs effectively and has a solid foundation for growth. This is an attractive prospect for partners seeking reliable and profitable ventures.
1.4 Gross Profit and Strategic Partnerships
Strategic partnerships can significantly impact a company’s gross profit by leveraging shared resources, expanding market reach, and improving operational efficiencies. Collaborations can lead to reduced costs, increased sales, and higher profit margins, making it an essential strategy for businesses looking to enhance their financial performance and attract valuable partnerships.
1.5. Gross Profit vs. Revenue: Understanding the Key Differences
While both gross profit and revenue are important financial metrics, they provide different insights into a company’s financial performance. Revenue, also known as sales or turnover, represents the total income generated from the sale of goods or services before any deductions. Gross profit, on the other hand, is the revenue remaining after deducting the cost of goods sold (COGS). Here’s a table highlighting the key differences:
| Feature | Revenue | Gross Profit |
|---|---|---|
| Definition | Total income from sales before deductions | Revenue minus cost of goods sold (COGS) |
| Calculation | Total sales income | Revenue – COGS |
| Insight Provided | Total sales performance | Profitability of core business activities |
| Impact of COGS | Not affected by COGS | Directly affected by COGS |
| Strategic Use | Measures market demand and sales efficiency | Assesses production and pricing efficiency |
| Example | A company sells $1,000,000 worth of products | $1,000,000 (Revenue) – $600,000 (COGS) = $400,000 |
Understanding the distinction between revenue and gross profit allows businesses to gain a clearer picture of their financial performance, enabling more informed strategic decisions.
2. Finding Gross Profit on the Income Statement: A Step-by-Step Guide
Gross profit is a key figure on the income statement. It’s calculated by subtracting the cost of goods sold (COGS) from the net revenue. Knowing where to find it and how to interpret it is essential for assessing a company’s financial health.
2.1 Locating the Income Statement
The income statement, also known as the profit and loss (P&L) statement, is a financial report that shows a company’s financial performance over a specific period. It’s typically found in a company’s annual or quarterly reports, which are available on their website, through financial databases, or from regulatory filings like the SEC’s EDGAR database.
2.2 Identifying Revenue
Revenue, often referred to as net sales or turnover, is usually the first line item on the income statement. It represents the total income generated from the sale of goods or services during the reporting period. This figure is crucial as it sets the stage for calculating gross profit and other profitability metrics.
2.3 Pinpointing Cost of Goods Sold (COGS)
Cost of Goods Sold (COGS) typically appears directly beneath the revenue line on the income statement. It includes all direct costs associated with producing or acquiring the goods or services sold. These costs may encompass raw materials, direct labor, and manufacturing overhead. COGS is a critical component in determining gross profit, as it reflects the direct expenses incurred in generating revenue.
2.4 Calculating Gross Profit
Gross profit is calculated by subtracting the cost of goods sold (COGS) from the net revenue. The formula is:
Gross Profit = Net Revenue – Cost of Goods Sold (COGS)
This calculation reveals the profit a company makes after accounting for the direct costs of production or service delivery, providing a clear picture of its operational efficiency.
2.5 Understanding Gross Profit Margin
The gross profit margin is a percentage that indicates the proportion of revenue remaining after accounting for the cost of goods sold (COGS). It is calculated as:
Gross Profit Margin = (Gross Profit / Net Revenue) × 100
A higher gross profit margin indicates greater efficiency in production and pricing strategies. This metric allows for easy comparison between companies and industries, providing valuable insights into a company’s profitability and operational effectiveness.
 Gross Profit
Image: Gross profit formula subtracting cost of goods sold from net revenue, illustrating how to calculate a company’s earnings after accounting for production costs.
3. Utilizing the Gross Profit Formula for Strategic Growth
The gross profit formula is not just a calculation; it’s a strategic tool that can drive business growth. By understanding and leveraging this formula, companies can identify areas for improvement, optimize their operations, and increase profitability, making them more attractive partners.
3.1 The Basic Gross Profit Formula
The gross profit formula is straightforward:
Gross Profit = Net Revenue – Cost of Goods Sold (COGS)
This simple equation provides a clear understanding of a company’s profitability from its core operations. By analyzing each component of the formula, businesses can identify areas where they can improve efficiency and increase their gross profit.
3.2 Strategies to Increase Net Revenue
Increasing net revenue is a direct way to boost gross profit. Strategies to achieve this include:
- Pricing Optimization: Adjusting prices based on market demand, competitive pricing, and perceived value.
- Sales and Marketing: Implementing effective sales strategies and marketing campaigns to attract more customers.
- Product/Service Expansion: Introducing new products or services to cater to a broader audience.
- Customer Retention: Building customer loyalty to ensure repeat business and increase lifetime value.
- Market Expansion: Entering new geographic or demographic markets to tap into additional revenue streams.
3.3 Methods to Reduce Cost of Goods Sold (COGS)
Reducing the cost of goods sold (COGS) can significantly increase gross profit. Effective methods include:
- Supply Chain Optimization: Streamlining the supply chain to reduce costs associated with procurement, transportation, and storage.
- Negotiating with Suppliers: Securing better pricing and terms from suppliers through negotiation and bulk purchasing.
- Improving Production Efficiency: Implementing lean manufacturing principles and automation to reduce waste and increase productivity.
- Inventory Management: Optimizing inventory levels to minimize holding costs and prevent obsolescence.
- Outsourcing: Outsourcing certain production processes to lower-cost regions or specialized providers.
3.4 The Impact of Gross Profit on Investment Decisions
Gross profit is a key metric that investors consider when making investment decisions. A company with a consistently high gross profit margin is generally seen as a more attractive investment because it indicates efficient operations and strong profitability. This can lead to higher stock prices, increased investor confidence, and greater access to capital.
3.5 Gross Profit as an Indicator of Financial Health
Gross profit serves as a reliable indicator of a company’s financial health. It reflects the company’s ability to generate profit from its core operations before accounting for other expenses. A growing gross profit suggests that the company is becoming more efficient and profitable, while a declining gross profit may signal underlying issues that need to be addressed.
4. Industry Benchmarks for Gross Profit: What’s Considered Good?
Classifying a company’s gross profit as “good” depends heavily on the industry it operates in. Different industries have varying cost structures and profit margins, so what is considered a healthy gross profit in one sector may be inadequate in another. Understanding these benchmarks is crucial for evaluating a company’s financial performance and potential for partnership.
4.1 The Importance of Industry-Specific Comparisons
Comparing a company’s gross profit to industry-specific benchmarks is essential for an accurate assessment of its financial health. Each industry has unique characteristics that influence its cost structure and profit margins. For instance, software companies often have higher gross profit margins than retail companies due to lower production costs. Therefore, comparing a software company’s gross profit to that of a retail company would not provide a meaningful comparison.
4.2 Examples of Gross Profit Margins by Industry
Here are a few examples of typical gross profit margins across different industries:
- Software: 60% – 80%
- Retail: 20% – 40%
- Manufacturing: 15% – 30%
- Restaurant: 30% – 50%
- Healthcare: 40% – 60%
These figures are approximate and can vary depending on the specific company, its business model, and market conditions. However, they provide a general guideline for what is considered a healthy gross profit margin in each industry.
4.3 Factors Influencing Gross Profit Margins
Several factors can influence a company’s gross profit margin, including:
- Competition: Higher competition can drive down prices and reduce margins.
- Supply Chain Efficiency: Efficient supply chains can lower costs and increase margins.
- Pricing Strategy: Premium pricing can increase margins, while discount pricing can decrease them.
- Product Mix: Companies with a diverse product mix may have varying margins across different products.
- Economic Conditions: Economic downturns can reduce consumer spending and impact margins.
4.4 How to Research Industry Benchmarks
Researching industry benchmarks can provide valuable insights into a company’s performance. Here are some resources for finding this information:
- Industry Associations: Many industry associations publish reports and data on financial benchmarks.
- Financial Analysis Reports: Investment firms and research companies often provide detailed industry analysis.
- Government Data: Government agencies like the U.S. Census Bureau provide data on various industries.
- Financial News Outlets: Reputable financial news sources often report on industry trends and benchmarks.
4.5 Using Gross Profit to Identify Strong Partners
A company’s gross profit margin can be a key indicator of its potential as a partner. Companies with strong gross profit margins are typically more financially stable, have efficient operations, and are better positioned for growth. These are all desirable qualities in a partner.
5. Forecasting Gross Profit: Planning for the Future
Forecasting gross profit is an essential part of financial planning, allowing businesses to anticipate future performance and make informed decisions. Accurate forecasting can help companies optimize their operations, manage costs, and plan for growth, ultimately enhancing their attractiveness as partners.
5.1 Methods for Forecasting Gross Profit
There are several methods for forecasting gross profit, including:
- Historical Data Analysis: Analyzing past financial performance to identify trends and patterns.
- Regression Analysis: Using statistical models to predict future gross profit based on various factors.
- Budgeting: Developing a detailed budget that includes revenue projections and cost estimates.
- Scenario Planning: Creating multiple scenarios based on different assumptions about market conditions and business strategies.
- Industry Benchmarks: Using industry averages and trends to inform forecasts.
5.2 The Role of Gross Margin in Forecasting
Gross margin, calculated as (Gross Profit / Net Revenue) × 100, is a key metric in forecasting gross profit. By projecting future revenue and applying an estimated gross margin, companies can estimate their future gross profit. This method is particularly useful when historical data shows a consistent gross margin.
5.3 Incorporating Market Trends into Forecasts
Market trends can significantly impact a company’s gross profit. Factors such as changes in consumer demand, technological advancements, and competitive pressures should be considered when forecasting. Incorporating these trends can lead to more accurate and realistic forecasts.
5.4 Adjusting Forecasts Based on Strategic Initiatives
Strategic initiatives, such as new product launches, market expansions, and cost-cutting measures, can influence future gross profit. Forecasts should be adjusted to reflect the expected impact of these initiatives. This requires a thorough understanding of the potential benefits and risks associated with each initiative.
5.5 Using Forecasting to Attract Partners
Accurate gross profit forecasts can make a company more attractive to potential partners. By demonstrating a clear understanding of future financial performance, companies can instill confidence in partners and showcase their potential for growth and profitability. This can lead to more favorable partnership terms and increased investment opportunities.
6. Gross Profit vs. Net Income: Understanding the Difference
While gross profit and net income both measure a company’s profitability, they provide different insights into its financial performance. Gross profit focuses on the profitability of core operations, while net income reflects the overall profitability after all expenses are considered. Understanding the difference between these two metrics is crucial for a comprehensive financial analysis.
6.1 Defining Net Income
Net income, also known as net profit or the bottom line, is the profit a company earns after deducting all expenses, including operating expenses, interest, taxes, and other costs. It represents the total profit available to shareholders after all obligations have been met.
6.2 Key Differences Between Gross Profit and Net Income
| Feature | Gross Profit | Net Income |
|---|---|---|
| Definition | Revenue minus cost of goods sold (COGS) | Profit after deducting all expenses, including COGS, operating expenses, interest, and taxes |
| Calculation | Revenue – COGS | Gross Profit – Operating Expenses – Interest – Taxes |
| Scope | Profitability of core operations | Overall profitability of the company |
| Expenses Considered | Direct costs of production (COGS) | All expenses, including operating and non-operating expenses |
| Strategic Use | Assessing production and pricing efficiency | Evaluating overall financial performance |
| Example | A company has $1,000,000 in revenue and $600,000 in COGS, resulting in $400,000 gross profit | A company has $400,000 gross profit, $100,000 in operating expenses, $20,000 in interest, and $30,000 in taxes, resulting in $250,000 net income |
6.3 The Importance of Analyzing Both Metrics
Analyzing both gross profit and net income provides a comprehensive view of a company’s financial health. Gross profit reveals the efficiency of core operations, while net income reflects the overall profitability after all expenses are considered. By examining both metrics, investors and partners can gain a deeper understanding of a company’s financial strengths and weaknesses.
6.4 How Expenses Impact Net Income
Expenses play a significant role in determining net income. Operating expenses, such as selling, general, and administrative (SG&A) expenses, can significantly reduce net income. Interest expenses, which are the costs of borrowing money, also impact net income. Additionally, taxes, which are mandatory payments to the government, can further reduce net income.
6.5 Using Net Income to Assess Overall Financial Health
Net income is a critical metric for assessing a company’s overall financial health. It represents the profit available to shareholders after all obligations have been met. A growing net income suggests that the company is becoming more profitable and efficient, while a declining net income may signal underlying issues that need to be addressed.
7. Real-World Examples of Gross Profit Analysis
Examining real-world examples of gross profit analysis can provide valuable insights into how companies use this metric to make strategic decisions. By analyzing the gross profit of successful companies, businesses can learn how to optimize their operations, manage costs, and increase profitability.
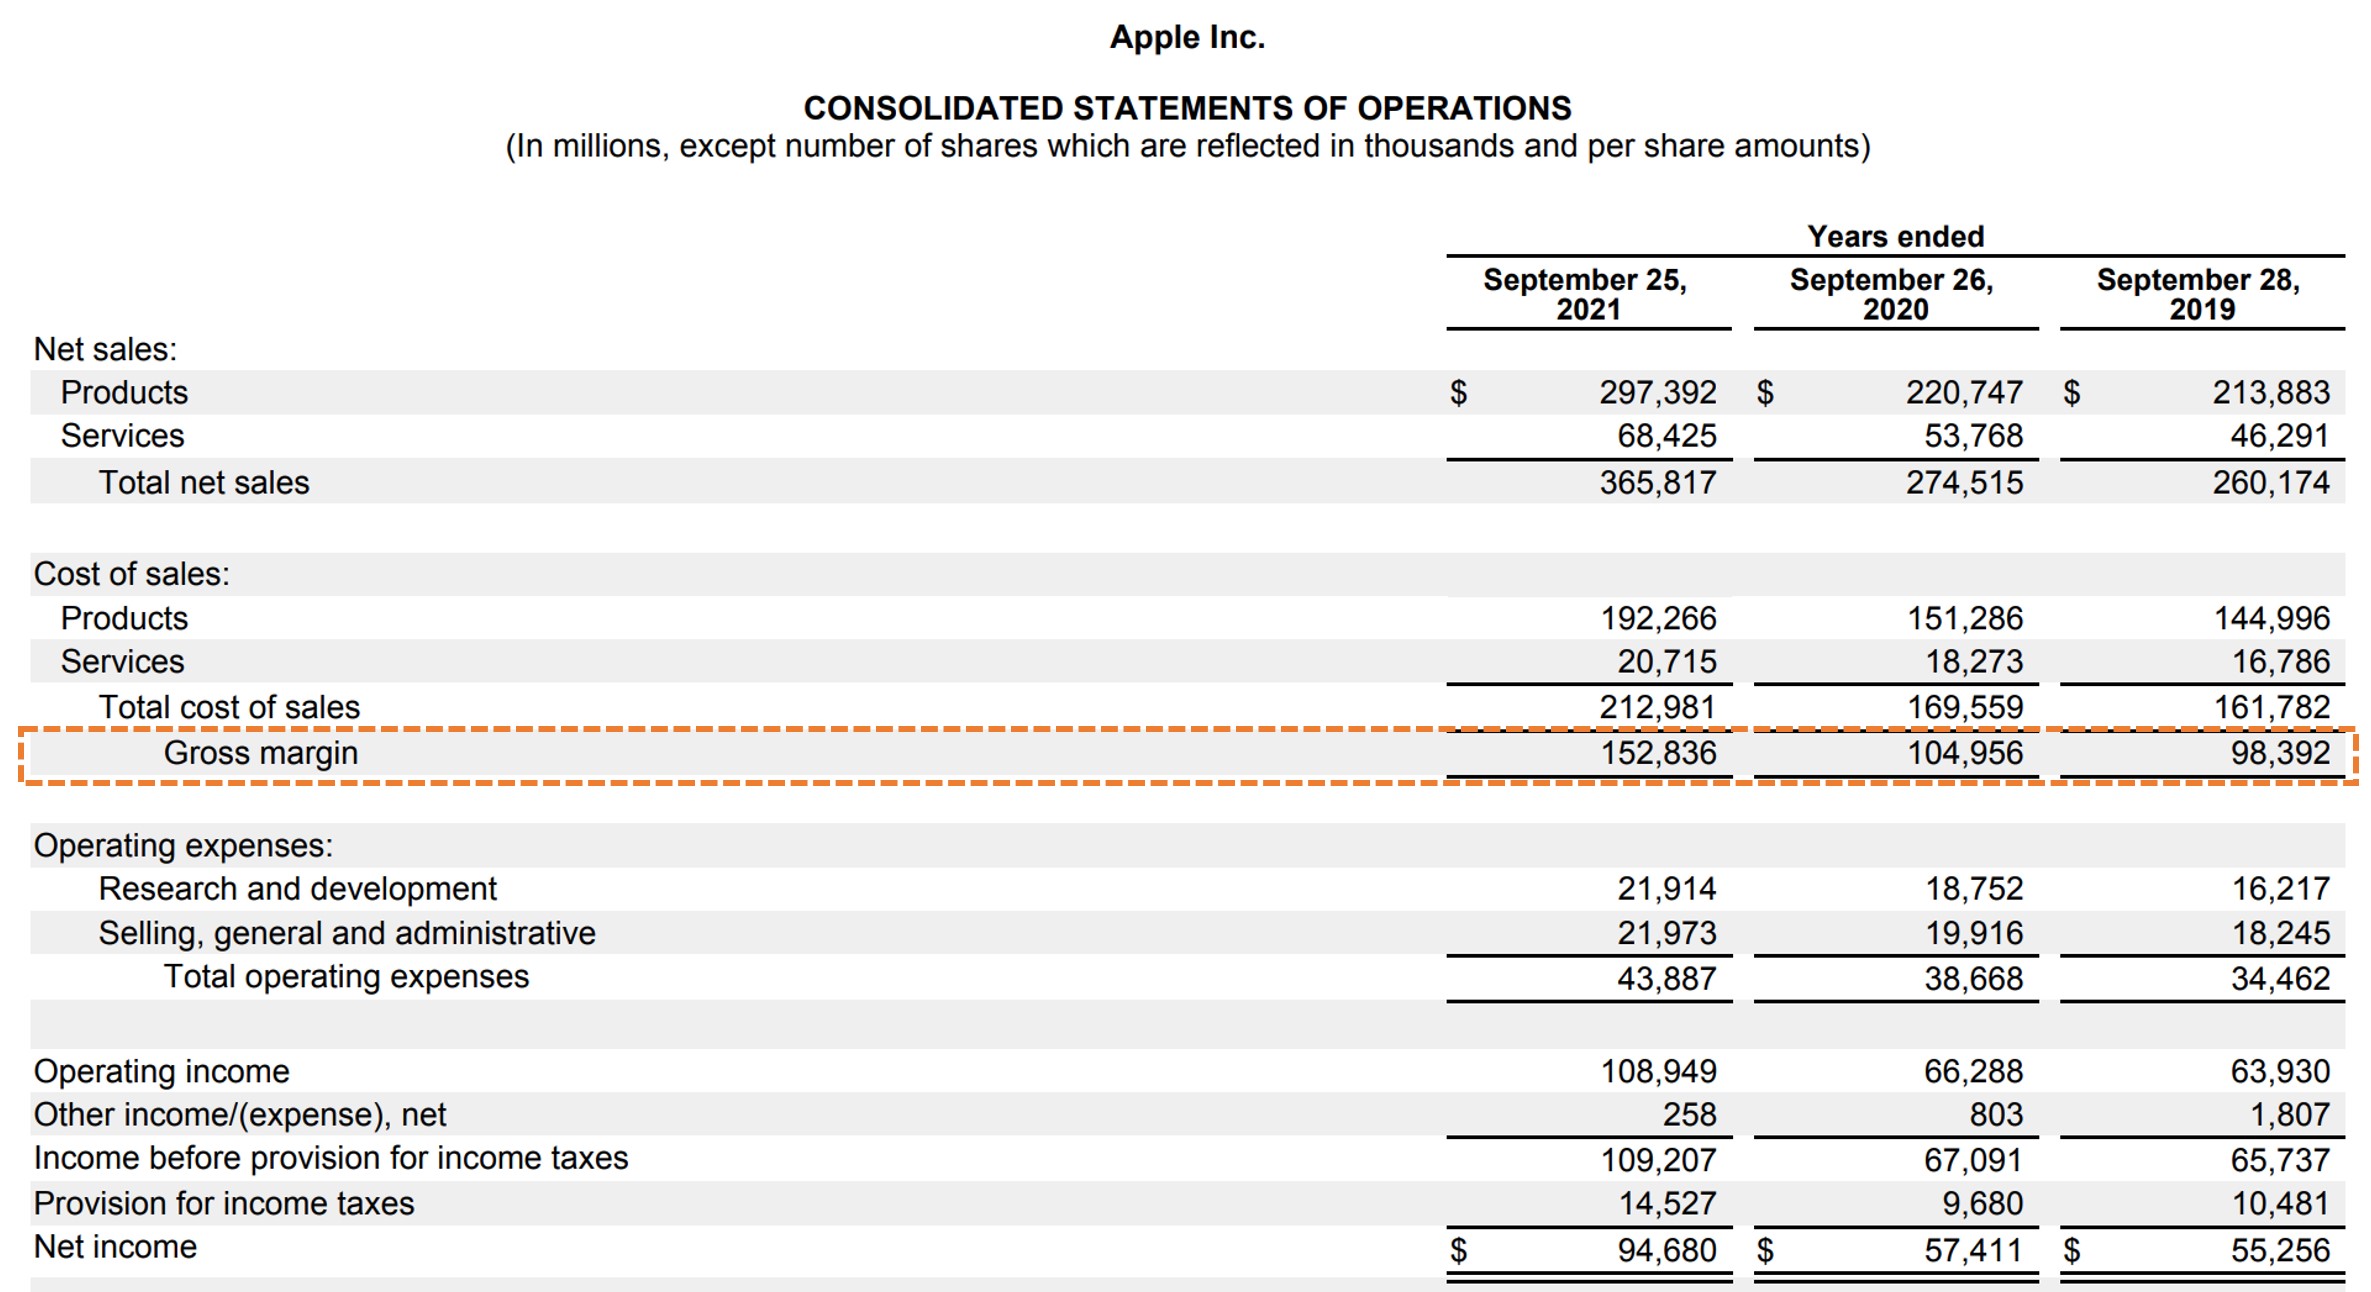
7.1 Apple Inc. (AAPL)
Apple Inc. (AAPL) is known for its high gross profit margins, which reflect its strong brand, premium pricing, and efficient supply chain. Apple’s gross profit margin consistently outperforms the industry average, demonstrating its ability to generate significant profit from its core operations.
 Gross Profit Apple (AAPL) Example
Image: Apple’s gross profit trend demonstrates consistent profitability and efficient operations from 2019 to 2021, reflecting a shift toward higher-margin software and service sales.
7.2 Walmart Inc. (WMT)
Walmart Inc. (WMT) operates with a lower gross profit margin compared to Apple, due to its focus on low prices and high sales volume. Walmart’s efficient supply chain and cost management strategies allow it to maintain profitability despite its lower margins.
7.3 Amazon.com Inc. (AMZN)
Amazon.com Inc. (AMZN) has a diverse business model, with varying gross profit margins across its different segments. Amazon’s e-commerce business has lower margins due to competitive pricing, while its cloud computing business (Amazon Web Services) has higher margins.
7.4 Analyzing Gross Profit Trends Over Time
Analyzing gross profit trends over time can provide valuable insights into a company’s performance. A growing gross profit indicates that the company is becoming more efficient and profitable, while a declining gross profit may signal underlying issues that need to be addressed.
7.5 Learning from Successful Companies
By studying the gross profit analysis of successful companies like Apple, Walmart, and Amazon, businesses can learn how to optimize their operations, manage costs, and increase profitability. This can lead to improved financial performance and greater success in the marketplace.
8. Tools and Resources for Gross Profit Analysis
Analyzing gross profit effectively requires the right tools and resources. These tools can help businesses gather data, perform calculations, and interpret results, leading to better decision-making and improved financial performance.
8.1 Spreadsheet Software (e.g., Microsoft Excel, Google Sheets)
Spreadsheet software like Microsoft Excel and Google Sheets are essential tools for gross profit analysis. These programs allow businesses to organize data, perform calculations, and create charts and graphs to visualize trends.
8.2 Accounting Software (e.g., QuickBooks, Xero)
Accounting software like QuickBooks and Xero can automate many of the tasks associated with gross profit analysis. These programs track revenue, expenses, and cost of goods sold, making it easier to calculate gross profit and monitor financial performance.
8.3 Financial Analysis Software (e.g., Bloomberg Terminal, FactSet)
Financial analysis software like Bloomberg Terminal and FactSet provide access to a wide range of financial data and analytical tools. These platforms can help businesses research industry benchmarks, analyze competitor performance, and forecast future gross profit.
8.4 Online Calculators and Templates
Online calculators and templates can simplify gross profit analysis. These resources provide pre-built formulas and templates that can be used to calculate gross profit, gross margin, and other key metrics.
8.5 Educational Resources and Courses
Educational resources and courses can help businesses improve their understanding of gross profit analysis. These resources may include online articles, tutorials, webinars, and formal courses on financial analysis and accounting.
9. Common Mistakes to Avoid in Gross Profit Analysis
Avoiding common mistakes in gross profit analysis is crucial for ensuring accurate and reliable results. These mistakes can lead to poor decision-making and negatively impact a company’s financial performance.
9.1 Inaccurate Data Entry
Inaccurate data entry is a common mistake that can skew gross profit calculations. Ensuring that revenue, cost of goods sold, and other financial data are entered correctly is essential for accurate analysis.
9.2 Ignoring Industry Benchmarks
Ignoring industry benchmarks can lead to unrealistic expectations and poor comparisons. Comparing a company’s gross profit to industry averages is crucial for assessing its performance and identifying areas for improvement.
9.3 Neglecting to Analyze Trends Over Time
Neglecting to analyze trends over time can result in a limited understanding of a company’s financial performance. Analyzing gross profit trends over several periods can reveal important insights into a company’s growth, efficiency, and profitability.
9.4 Overlooking the Impact of External Factors
Overlooking the impact of external factors, such as economic conditions, market trends, and competitive pressures, can lead to inaccurate forecasts and poor decision-making. Considering these factors is crucial for a comprehensive gross profit analysis.
9.5 Failing to Use the Right Tools and Resources
Failing to use the right tools and resources can make gross profit analysis more difficult and time-consuming. Utilizing spreadsheet software, accounting software, financial analysis software, and other resources can streamline the process and improve accuracy.
10. Partnering for Profit: How income-partners.net Can Help
At income-partners.net, we understand the importance of gross profit in driving business success. Our platform connects businesses with strategic partners who can help them optimize their operations, manage costs, and increase profitability. By partnering with the right companies, businesses can unlock new opportunities for growth and achieve significant revenue gains.
10.1 Connecting with Strategic Partners
income-partners.net provides a platform for businesses to connect with strategic partners who can offer complementary skills, resources, and expertise. These partnerships can lead to improved efficiency, reduced costs, and increased revenue.
10.2 Optimizing Operations and Managing Costs
Our partners can help businesses optimize their operations and manage costs, leading to higher gross profit margins. By streamlining processes, improving supply chain management, and implementing cost-saving measures, businesses can increase their profitability and financial stability.
10.3 Unlocking New Opportunities for Growth
Strategic partnerships can unlock new opportunities for growth by expanding market reach, entering new industries, and launching innovative products and services. These opportunities can lead to increased revenue and higher gross profit.
10.4 Building Long-Term, Profitable Relationships
income-partners.net focuses on building long-term, profitable relationships between businesses. By fostering collaboration, communication, and mutual support, we help our partners achieve sustainable growth and success.
10.5 Visit income-partners.net Today
Ready to take your business to the next level? Visit income-partners.net today to explore partnership opportunities, learn about our services, and connect with potential partners who can help you increase your gross profit and achieve your financial goals.
FAQ: Frequently Asked Questions About Finding Gross Profit in the Income Statement
1. What is the significance of gross profit in financial analysis?
Gross profit is a critical indicator of a company’s profitability from its core operations. It shows how efficiently a company manages its production costs and pricing, serving as a foundation for assessing financial health and making strategic decisions.
2. How do I locate the income statement to find the gross profit?
The income statement can be found in a company’s annual or quarterly reports, available on their website, through financial databases, or from regulatory filings like the SEC’s EDGAR database.
3. What is the basic formula for calculating gross profit?
The formula is: Gross Profit = Net Revenue – Cost of Goods Sold (COGS). This calculation reveals the profit after accounting for the direct costs of production or service delivery.
4. Why is it important to compare gross profit margins within the same industry?
Comparing gross profit margins within the same industry provides an accurate assessment of a company’s financial health, as different industries have varying cost structures and profit margins.
5. What factors influence a company’s gross profit margin?
Several factors can influence a company’s gross profit margin, including competition, supply chain efficiency, pricing strategy, product mix, and economic conditions.
6. How can forecasting gross profit benefit a business?
Accurate forecasting can help companies optimize their operations, manage costs, and plan for growth, enhancing their attractiveness as partners and leading to better decision-making.
7. What is the difference between gross profit and net income?
Gross profit focuses on the profitability of core operations, while net income reflects the overall profitability after all expenses, including operating expenses, interest, taxes, and other costs, are considered.
8. What are some common mistakes to avoid in gross profit analysis?
Common mistakes include inaccurate data entry, ignoring industry benchmarks, neglecting to analyze trends over time, overlooking external factors, and failing to use the right tools and resources.
9. How can strategic partnerships impact a company’s gross profit?
Strategic partnerships can significantly impact a company’s gross profit by leveraging shared resources, expanding market reach, and improving operational efficiencies, leading to reduced costs and increased sales.
10. How can income-partners.net help businesses improve their gross profit?
income-partners.net connects businesses with strategic partners who can help them optimize their operations, manage costs, and increase profitability, unlocking new opportunities for growth and achieving significant revenue gains.
By understanding the importance of gross profit and how to find it on the income statement, businesses can make informed decisions, optimize their operations, and build strategic partnerships to achieve sustainable growth and success. Explore the resources and opportunities available at income-partners.net to unlock your business’s full potential. Don’t hesitate to contact us at Address: 1 University Station, Austin, TX 78712, United States, Phone: +1 (512) 471-3434, or visit our website income-partners.net for more information and to connect with potential partners.