CVR Partners (UAN), operating under the ticker UAN on the NYSE, is a fascinating study in commodity investments, particularly within the Master Limited Partnership (MLP) structure. As a fertilizer producer, CVR Partners operates in a sector known for its commodity-driven volatility. While the stock’s unit price might suggest a lackluster performance over the past year, a deeper dive into their unique distribution policy reveals a more compelling story for investors. It’s crucial to look beyond the surface of Cvr Partners Stock and understand the nuances that truly drive returns.
Recent performance figures might initially deter investors. A hypothetical $1,000 investment in CVR Partners a year ago would have seemingly diminished to approximately $930 today. The units have indeed experienced a roughly 7% decline in the last 12 months, and are significantly down – nearly 40% – from their peak in late 2022. This contrasts sharply with the broader market, where the S&P 500 Index has surged by 15% over the same period, reaching near-record highs.
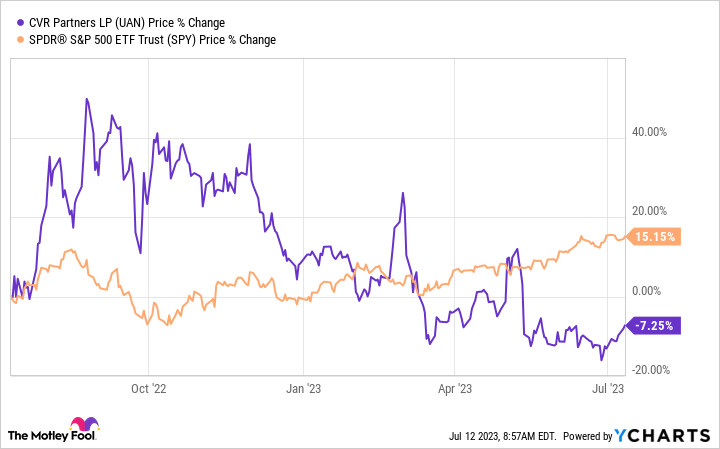 UAN Stock Chart Showing Price Decline
Image: Chart illustrating the decline in UAN stock price over the past year, contrasting with broader market performance.
However, the narrative shifts dramatically when considering CVR Partners’ distinctive approach to distributions. Unlike companies with fixed dividends, CVR Partners employs a variable distribution policy. According to the company’s stated policy, their board aims to distribute all available cash generated each quarter. This commitment to returning cash to unitholders is a defining characteristic and significantly impacts the overall investment picture.
To quantify this impact, consider the distributions paid out by CVR Partners over the past year. In August 2022, unitholders received a substantial $10.05 per unit, followed by $1.77 in November. Distributions then jumped back to impressive levels in 2023, with $10.50 in March and $10.43 in May. Over just twelve months, the total distributions amounted to a remarkable $32.75 per unit. Ignoring these substantial payouts provides an incomplete and potentially misleading view of CVR Partners stock performance.
Unveiling the Total Return of CVR Partners Stock
While some investors may utilize dividend income for immediate expenses, a comprehensive evaluation of investment performance necessitates considering total return. This metric assumes that all distributions are reinvested, capturing the true growth of an investment. Analyzing CVR Partners stock through the lens of total return paints a vastly different, and more positive, picture.
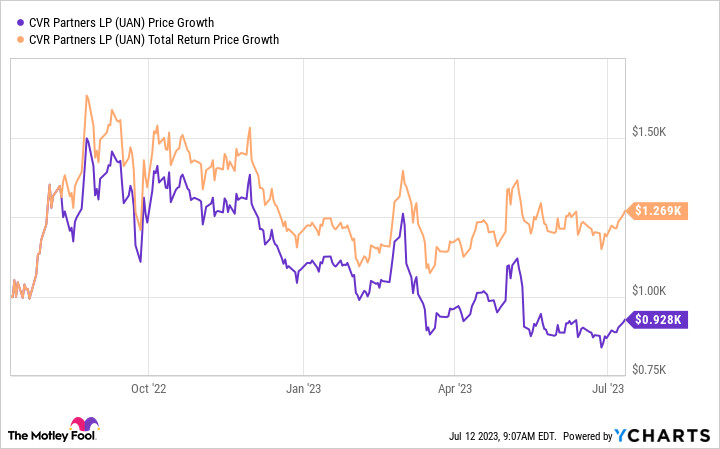 UAN Stock Total Return Chart
Image: Chart demonstrating the positive total return of UAN stock, factoring in reinvested distributions over the past year.
As illustrated in the chart above, a $1,000 investment in CVR Partners stock one year prior would have actually grown to approximately $1,270 when distributions are reinvested. This represents a significant $340 difference, highlighting the substantial contribution of distributions to overall returns within a relatively short timeframe.
Furthermore, comparing CVR Partners’ total return to the S&P 500 reveals an interesting dynamic. While the S&P 500 offers a modest dividend yield of around 1.5%, its dividend contribution to total return is comparatively small. As shown in the following chart, dividends added roughly $20 to the S&P 500’s total return over the past year. However, CVR Partners’ robust distributions enabled it to outperform the S&P 500, showcasing the power of its variable distribution policy in favorable commodity environments.
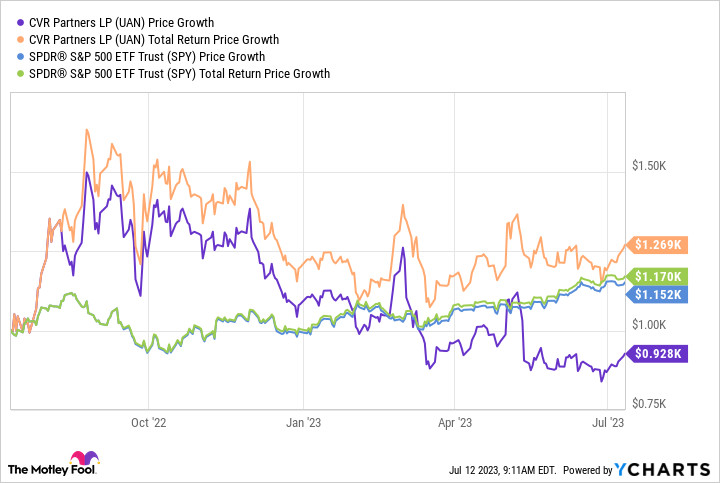 UAN Stock vs S&P 500 Total Return Comparison Chart
Image: Comparative chart illustrating UAN stock’s outperformance of the S&P 500 in terms of total return over the last year, largely due to distributions.
Before investors become overly enthusiastic about CVR Partners stock, it is imperative to acknowledge the inherent limitations and risks associated with its distribution model. While the distribution yield may appear exceptionally high at 41%, this figure is based on past performance and is not a guaranteed future yield due to the variable nature of the policy. The fluctuation in distributions is evident when noting the lower $1.77 distribution amidst payouts typically around $10. Consistency should not be expected. Should distribution levels revert to lower ranges, the future total returns of CVR Partners stock will likely be less impressive.
Understanding the Full Picture of CVR Partners Stock
Investing in CVR Partners stock, or any investment for that matter, requires a nuanced approach that goes beyond simplistic metrics. In the case of CVR Partners, the seemingly high distribution yield should be viewed with caution, just as the unit price decline alone provides an incomplete picture. Total return offers a more accurate reflection of performance, particularly for MLPs with variable distribution policies.
Ultimately, CVR Partners stock has provided substantial returns to unitholders over the past year, largely driven by its generous distributions. However, the inherent unpredictability of commodity markets and the variable nature of its distribution policy mean that future performance remains uncertain. Investors considering CVR Partners stock must thoroughly understand its commodity-based business, its distribution policy, and the factors that can influence both.