What’s another name for an income statement? It’s also known as a Profit and Loss (P&L) statement, offering a clear snapshot of a company’s financial performance over a specific period. At income-partners.net, we help you understand how this statement, under any name, empowers strategic partnerships and revenue growth. Mastering this financial tool is essential for successful business collaborations, financial health, and ultimately, increased profitability, so be sure to keep reading!
1. Understanding the Income Statement: Synonyms and Significance
The income statement, regardless of its alias, is a cornerstone of financial analysis. It’s crucial for anyone looking to invest, partner, or understand a business’s financial health.
1.1. What Are the Different Names for an Income Statement?
Beyond “Income Statement,” here are other common terms:
- Profit and Loss (P&L) Statement: This is the most frequent alternative name.
- Statement of Profit or Loss: A more formal variation.
- Statement of Earnings: Highlights the company’s earnings performance.
- Statement of Operations: Emphasizes the operational activities that generate revenue and incur expenses.
- Statement of Financial Performance: A broad term encompassing the overall financial results.
1.2. Why Are These Different Names Used?
The different names often reflect subtle nuances in emphasis or regional preferences. For example, “Profit and Loss Statement” is very common in everyday business conversation. “Statement of Operations” might be favored when the focus is on core business activities.
1.3. Why is the Income Statement Important?
The income statement provides critical insights. It helps:
- Assess Profitability: Determine if a company is making money and how efficiently.
- Track Revenue and Expenses: Understand where money is coming from and where it’s going.
- Make Informed Decisions: Guide investment, partnership, and operational decisions.
- Compare Performance: Evaluate a company’s performance against its competitors or its own historical data.
- Attract Investors: A strong income statement can attract potential investors, which is vital in the business world.
2. Key Components of an Income Statement: A Deeper Dive
Understanding the components of an income statement is critical to interpreting its information.
2.1. Revenue: The Top Line
This represents the total income generated from the company’s primary business activities.
- Operating Revenue: Revenue from core business operations (e.g., sales of goods or services).
- Non-Operating Revenue: Revenue from secondary activities (e.g., interest income, rental income).
2.2. Cost of Goods Sold (COGS): The Direct Costs
This includes the direct costs associated with producing goods or services sold.
- Direct Materials: Raw materials used in production.
- Direct Labor: Wages paid to workers directly involved in production.
- Manufacturing Overhead: Indirect costs related to production (e.g., factory rent, utilities).
2.3. Gross Profit: Revenue Minus COGS
This represents the profit a company makes after deducting the direct costs of producing its goods or services.
- Gross Profit Margin: (Gross Profit / Revenue) x 100. This ratio indicates the percentage of revenue remaining after covering direct production costs.
2.4. Operating Expenses: Running the Business
These are the expenses incurred in running the business, excluding COGS.
- Selling, General, and Administrative (SG&A) Expenses: Costs associated with selling products, managing the business, and administrative functions (e.g., salaries, rent, marketing).
- Research and Development (R&D) Expenses: Costs associated with developing new products or services.
- Depreciation and Amortization: The allocation of the cost of long-term assets over their useful lives.
2.5. Operating Income: Profit from Core Operations
This is the profit a company makes from its core business operations before interest and taxes. It’s calculated as Gross Profit minus Operating Expenses.
- Operating Margin: (Operating Income / Revenue) x 100. This ratio indicates the percentage of revenue remaining after covering both direct production costs and operating expenses.
2.6. Interest Expense: The Cost of Borrowing
This is the expense incurred on debt financing.
2.7. Income Before Taxes (EBT): Profit Before Taxes
This is the profit a company makes before paying income taxes. It’s calculated as Operating Income minus Interest Expense.
2.8. Income Tax Expense: Taxes Owed
This is the amount of income taxes a company owes to the government.
2.9. Net Income: The Bottom Line
This is the final profit a company makes after deducting all expenses, including taxes. It’s calculated as Income Before Taxes minus Income Tax Expense. This number is often referred to as “the bottom line.”
- Net Profit Margin: (Net Income / Revenue) x 100. This ratio indicates the percentage of revenue remaining after covering all expenses, including taxes.
3. Single-Step vs. Multi-Step Income Statements: Choosing the Right Format
There are two primary formats for income statements: single-step and multi-step. The choice depends on the complexity of the business and the level of detail required.
3.1. Single-Step Income Statement: Simplicity in Action
This format is straightforward, summing all revenues and gains, then subtracting all expenses and losses to arrive at net income.
- Formula: Net Income = (Total Revenues + Total Gains) – (Total Expenses + Total Losses)
- Advantages: Simple to prepare and understand, suitable for small businesses with uncomplicated operations.
- Disadvantages: Lacks detailed information about different types of revenues and expenses, making it difficult to assess operational efficiency.
3.2. Multi-Step Income Statement: Detail and Analysis
This format separates operating revenues and expenses from non-operating items to arrive at various levels of profitability, such as gross profit, operating income, and net income.
- Formula:
- Gross Profit = Revenue – Cost of Goods Sold
- Operating Income = Gross Profit – Operating Expenses
- Income Before Taxes = Operating Income – Interest Expense
- Net Income = Income Before Taxes – Income Tax Expense
- Advantages: Provides a more detailed view of a company’s financial performance, allowing for better analysis of profitability and efficiency.
- Disadvantages: More complex to prepare and understand, requiring more detailed accounting records.
3.3. Which Format Should You Use?
- Small Businesses: A single-step income statement may suffice for small businesses with simple operations.
- Large Corporations: A multi-step income statement is generally preferred for larger companies due to its greater detail and analytical capabilities.
4. Analyzing an Income Statement: Key Ratios and Metrics
The income statement is more than just a collection of numbers; it’s a story about a company’s financial performance. Here are some key ratios and metrics to help you interpret that story:
4.1. Gross Profit Margin: Efficiency in Production
This ratio measures the percentage of revenue remaining after covering the direct costs of producing goods or services. A higher gross profit margin indicates greater efficiency in production.
- Formula: (Gross Profit / Revenue) x 100
- Interpretation: A rising gross profit margin suggests improved production efficiency, while a falling margin may indicate rising costs or pricing pressures.
4.2. Operating Margin: Profitability from Core Operations
This ratio measures the percentage of revenue remaining after covering both direct production costs and operating expenses. A higher operating margin indicates greater profitability from core operations.
- Formula: (Operating Income / Revenue) x 100
- Interpretation: A rising operating margin suggests improved operational efficiency, while a falling margin may indicate rising operating expenses or declining sales.
4.3. Net Profit Margin: Overall Profitability
This ratio measures the percentage of revenue remaining after covering all expenses, including taxes. A higher net profit margin indicates greater overall profitability.
- Formula: (Net Income / Revenue) x 100
- Interpretation: A rising net profit margin suggests improved overall profitability, while a falling margin may indicate rising expenses or declining sales.
4.4. Revenue Growth Rate: Expansion and Opportunity
This metric measures the percentage change in revenue over a period of time. A positive revenue growth rate indicates that a company is expanding its sales.
- Formula: ((Current Period Revenue – Prior Period Revenue) / Prior Period Revenue) x 100
- Interpretation: A high revenue growth rate may indicate strong demand for a company’s products or services, while a low or negative growth rate may suggest declining sales or market share.
4.5. Expense Ratio: Cost Control and Efficiency
This ratio measures the percentage of revenue consumed by a specific expense category. It can be used to assess a company’s cost control efforts.
- Formula: (Specific Expense / Revenue) x 100
- Interpretation: A rising expense ratio may indicate that a company is struggling to control costs, while a falling ratio may suggest improved cost management.
5. The Income Statement in Strategic Partnerships: A Powerful Tool for Growth
The income statement is crucial when forming strategic partnerships. It provides insights into a potential partner’s financial health, profitability, and growth potential.
5.1. Assessing a Partner’s Financial Stability
- Review Revenue Trends: Is the partner’s revenue growing, declining, or stable?
- Analyze Profitability: Is the partner consistently profitable? What are their profit margins?
- Evaluate Expense Management: How well does the partner control its expenses?
- Look for Red Flags: Are there any unusual trends or anomalies in the income statement that warrant further investigation?
5.2. Identifying Synergies and Opportunities
- Complementary Products or Services: Can the partnership create new revenue streams by combining offerings?
- Cost Savings: Can the partnership reduce expenses through shared resources or economies of scale?
- Market Expansion: Can the partnership help each company reach new markets or customers?
5.3. Negotiating Fair and Equitable Agreements
- Valuation: The income statement can be used to estimate the value of each partner’s contribution to the partnership.
- Profit Sharing: The income statement can help determine a fair and equitable distribution of profits.
- Risk Allocation: The income statement can help assess the potential risks and rewards of the partnership.
At income-partners.net, we specialize in connecting businesses with strategic partners. A thorough understanding of income statements is essential to find the right fit.
5.4. Income Statement for Investment Decisions
- Determine Earnings Potential: The income statement is the basis for all earnings related projections and models.
- Identify Trends: A strong track record of earnings is a good indicator of consistent management skills.
- Compare with Competition: The income statement can easily be compared to competitors so investors can get an idea of how the company is performing against its peer group.
5.5. Income Statement for Lenders
- Ability to Pay Back Debt: An investor can get a clear idea on the company’s ability to pay back its debt by looking at the bottom line of the income statement.
- Profitability Ratios: Lenders rely on profitability ratios derived from the income statement to decide whether to lend money to the company.
- Identify Trends: Lenders can use the income statement to identify trends that can put the company in a better or worse position to pay off its debt.
6. Common Mistakes to Avoid When Analyzing Income Statements
Analyzing income statements can be complex, and it’s easy to make mistakes if you’re not careful. Here are some common pitfalls to avoid:
6.1. Ignoring Non-Recurring Items
- Problem: Non-recurring items (e.g., one-time gains or losses) can distort a company’s true financial performance.
- Solution: Focus on operating income, which excludes non-recurring items, to get a clearer picture of the company’s core profitability.
6.2. Focusing Solely on the Bottom Line
- Problem: Net income is just one piece of the puzzle. It’s important to analyze the individual components of the income statement to understand how a company is generating its profits.
- Solution: Examine revenue trends, cost of goods sold, operating expenses, and other key metrics to get a more complete understanding of a company’s financial performance.
6.3. Failing to Compare to Industry Benchmarks
- Problem: A company’s financial performance should be evaluated in the context of its industry.
- Solution: Compare a company’s financial ratios and metrics to industry averages to see how it stacks up against its competitors.
6.4. Overlooking Accounting Changes
- Problem: Changes in accounting methods can affect a company’s reported financial results.
- Solution: Be aware of any accounting changes and understand how they may impact the comparability of financial statements.
6.5. Ignoring the Notes to the Financial Statements
- Problem: The notes to the financial statements provide important information about a company’s accounting policies, assumptions, and estimates.
- Solution: Read the notes carefully to gain a deeper understanding of the financial statements.
7. The Future of Income Statements: Trends and Innovations
The income statement is evolving to meet the changing needs of businesses and investors. Here are some emerging trends and innovations:
7.1. Enhanced Disclosure of Non-Financial Information
- Trend: Companies are increasingly disclosing non-financial information, such as environmental, social, and governance (ESG) metrics, in their financial reports.
- Impact: This provides a more holistic view of a company’s performance, considering its impact on society and the environment.
7.2. Real-Time Reporting
- Trend: Technology is enabling companies to provide real-time financial data to investors and other stakeholders.
- Impact: This allows for more timely and informed decision-making.
7.3. Artificial Intelligence (AI) and Machine Learning (ML)
- Trend: AI and ML are being used to automate financial analysis, identify patterns, and predict future performance.
- Impact: This can improve the efficiency and accuracy of financial analysis.
7.4. Blockchain Technology
- Trend: Blockchain technology is being used to create more transparent and secure financial reporting systems.
- Impact: This can reduce the risk of fraud and improve the reliability of financial data.
8. Income Statement Example
Below is an example of an income statement.
| For the Year Ended December 31, 2023 | |
|---|---|
| Revenue | $1,000,000 |
| Cost of Goods Sold | ($600,000) |
| Gross Profit | $400,000 |
| Operating Expenses | |
| Salaries and Wages | ($100,000) |
| Rent | ($20,000) |
| Utilities | ($10,000) |
| Depreciation | ($5,000) |
| Advertising | ($5,000) |
| Total Operating Expenses | ($140,000) |
| Operating Income | $260,000 |
| Interest Expense | ($10,000) |
| Income Before Taxes | $250,000 |
| Income Tax Expense (21% tax rate) | ($52,500) |
| Net Income | $197,500 |
9. Frequently Asked Questions About Income Statements
Here are some commonly asked questions about income statements.
9.1. What is the primary purpose of an income statement?
The primary purpose is to show a company’s financial performance over a period, revealing its profitability by detailing revenues, expenses, and net income.
9.2. How often are income statements typically prepared?
Income statements are commonly prepared quarterly and annually, allowing stakeholders to monitor the company’s financial health regularly.
9.3. What’s the difference between revenue and net income?
Revenue is the total income from sales before any deductions, while net income is the profit remaining after all expenses, including taxes, have been subtracted.
9.4. What does COGS include?
COGS includes all direct costs related to producing goods or services, such as raw materials, direct labor, and manufacturing overhead.
9.5. Why is gross profit important?
Gross profit indicates a company’s efficiency in managing production costs. It provides a clear view of how much revenue is left after covering the direct costs of making products or providing services.
9.6. What are operating expenses?
Operating expenses are costs incurred from a company’s normal business activities, including rent, utilities, salaries, wages, and marketing expenses.
9.7. How does depreciation affect the income statement?
Depreciation reduces net income by allocating the cost of an asset over its useful life, reflecting the wear and tear on assets each year.
9.8. What does EBT tell you about a company?
EBT indicates a company’s profitability before considering the impact of taxes. It’s useful for comparing companies with different tax rates.
9.9. Why should investors review an income statement?
Investors review an income statement to assess a company’s profitability, efficiency, and overall financial health, aiding in informed investment decisions.
9.10. How can an income statement help in strategic partnership decisions?
The income statement provides essential data to assess potential partners’ financial stability, identify synergies, and negotiate equitable agreements, ensuring beneficial partnerships.
10. Call to Action
Ready to take your business to the next level? Understanding income statements is just the beginning. Visit income-partners.net today to explore a wealth of resources, strategies, and opportunities to build profitable partnerships and drive revenue growth. Discover the power of collaboration and unlock your business’s full potential! Contact us at Address: 1 University Station, Austin, TX 78712, United States. Phone: +1 (512) 471-3434. Let income-partners.net be your guide to financial success.
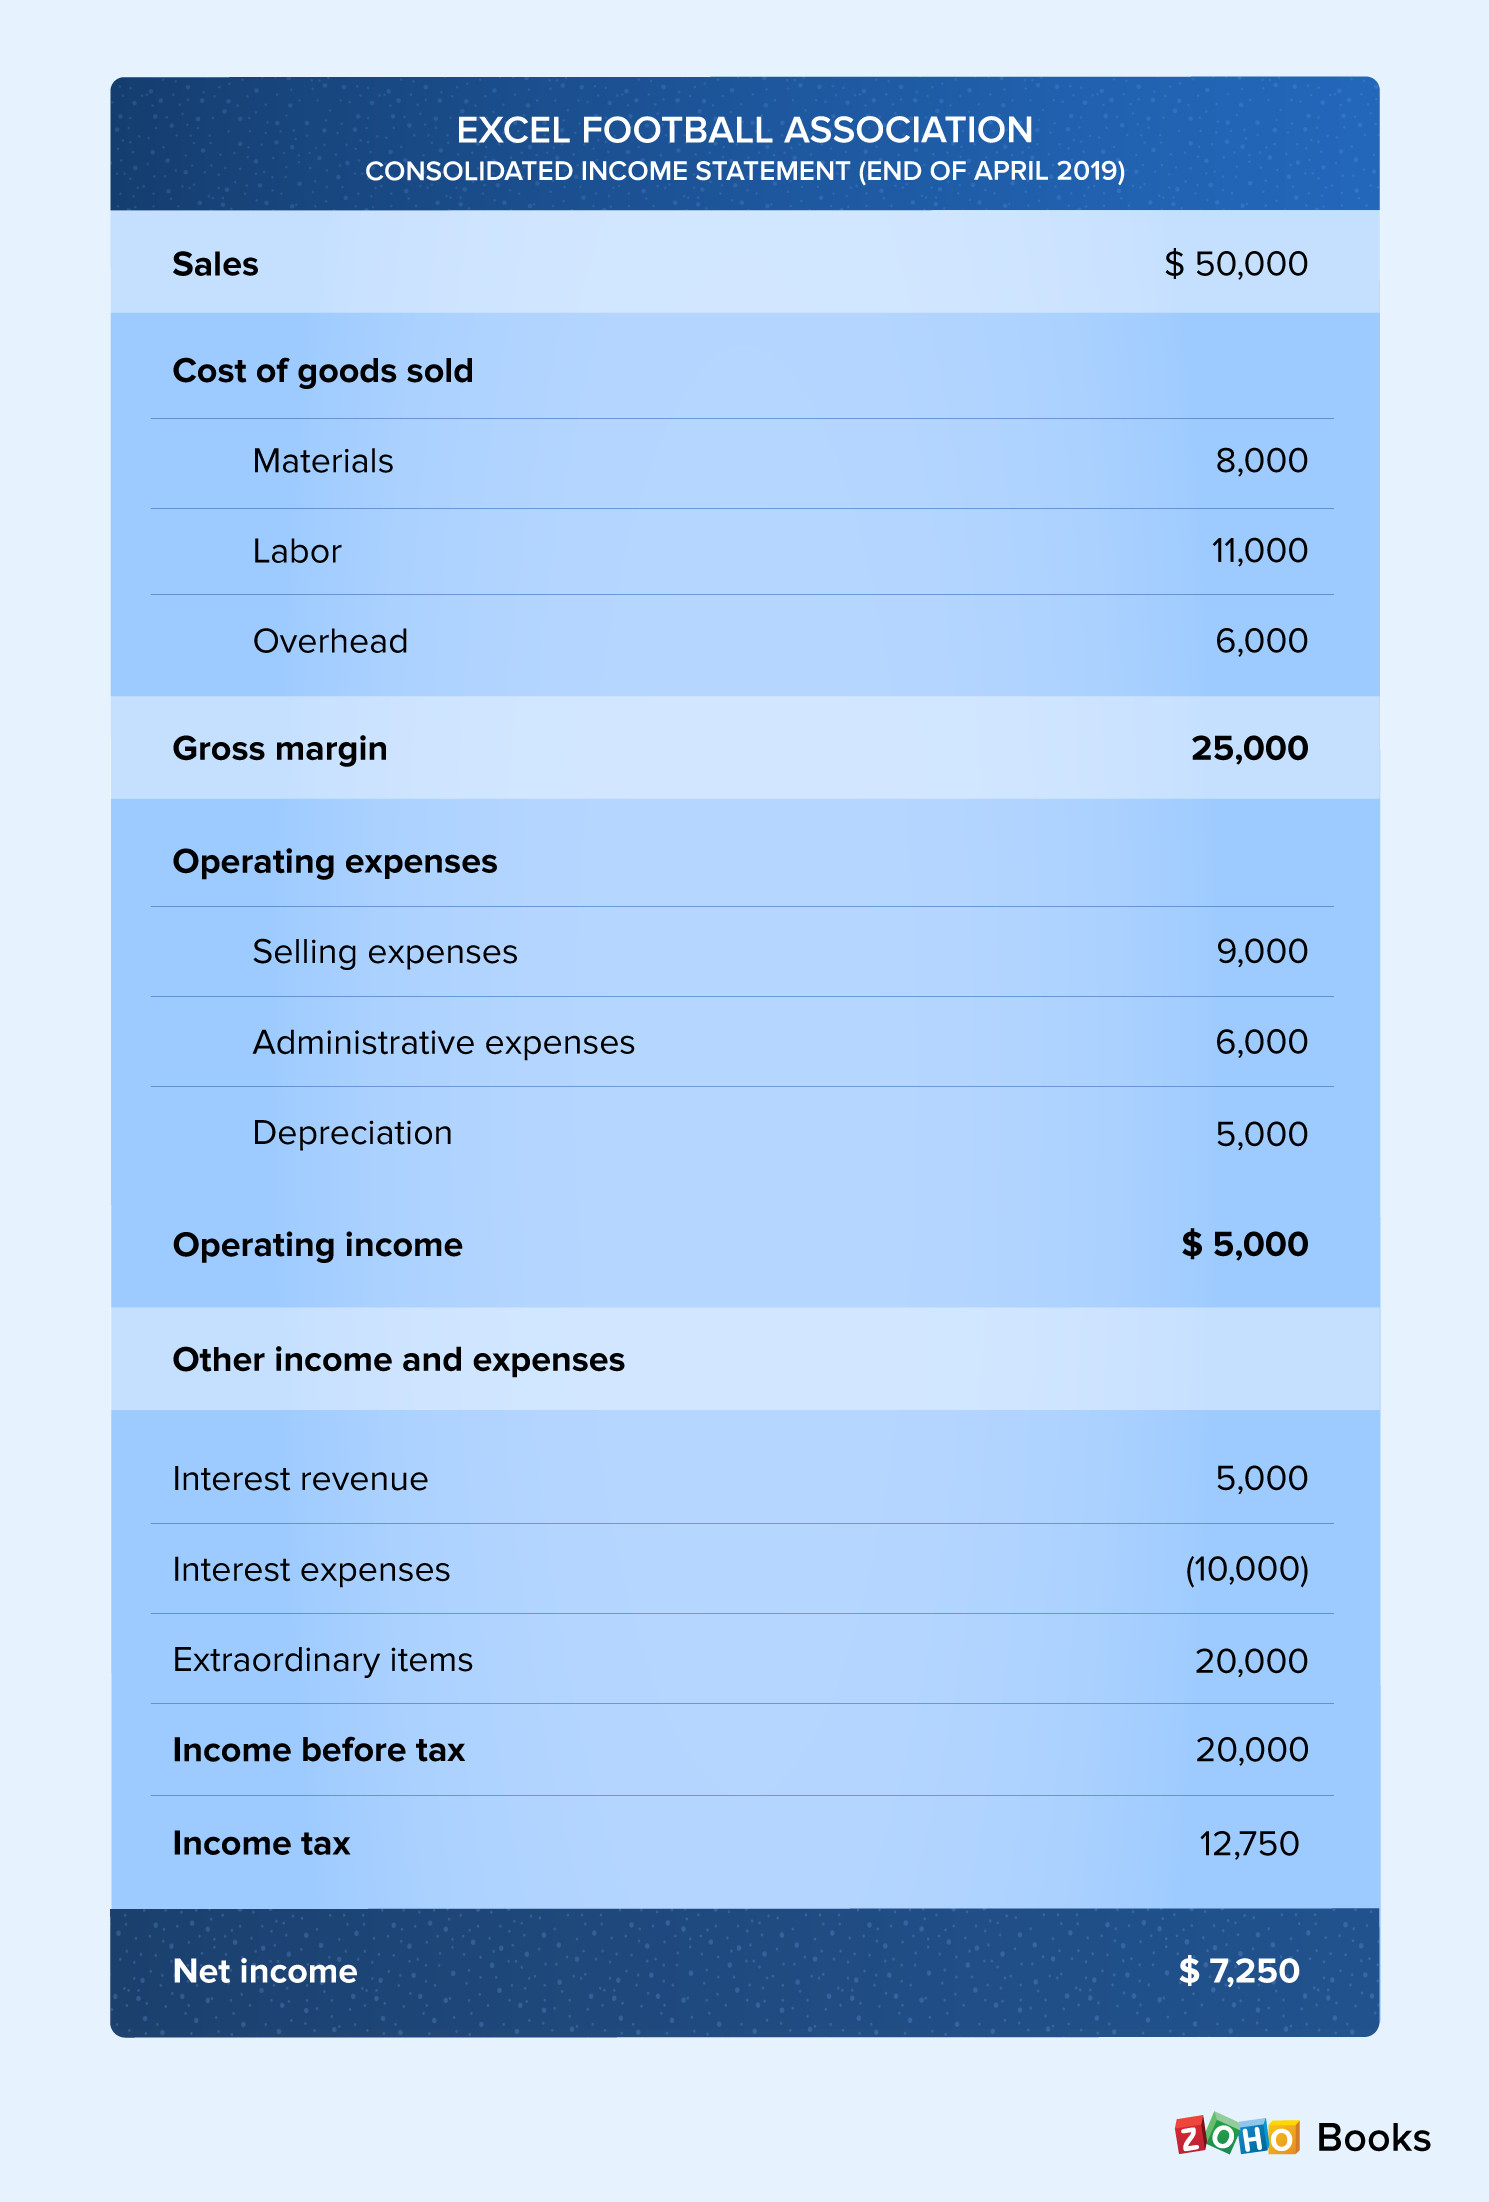 Financial chart showing income growth
Understanding the different components of an income statement provides critical insights into a company’s financial performance, aiding in strategic decision-making.
 Business partners reviewing financial data on a laptop
Business partners collaborating and analyzing financial data on a laptop enhances strategic planning and partnership success.